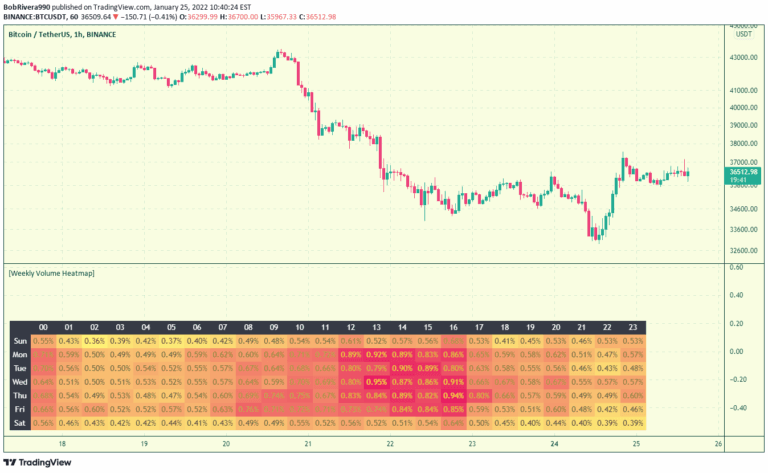
A volume heat map indicator that colors volume bars and candles based on the standard deviation of trading volume from its average. Provides visual insights into volume intensity and potential market significance.
Explore complementary indicator rolesHow it works
The volume heat map calculates volume deviation by comparing current trading volume to historical average volume. It determines how many standard deviations the current volume is from the mean, creating color-coded zones that represent volume intensity.
High standard deviation values indicate significant volume spikes, while low values suggest typical trading activity. The indicator uses statistical analysis to transform raw volume data into visually interpretable color gradients. By mapping volume variations, traders can quickly identify unusual trading activity and potential market turning points
Why it may be useful
Volume heat maps provide critical visual insights into market dynamics and trading sentiment. They help traders understand the strength behind price movements by highlighting volume abnormalities. By revealing periods of high or low trading activity, these indicators can signal potential trend reversals, breakouts, or consolidation phases.
The color-coded visualization makes it easier to interpret complex volume data quickly. Traders can use these insights to confirm trend strength, identify potential entry or exit points, and assess market participation
When to explore it
Volume heat maps are most effective during periods of market transition or potential trend changes. They work best in liquid markets with consistent trading volumes, such as major stock indices, forex pairs, and popular cryptocurrencies.
Traders should use this indicator during significant economic events, earnings releases, or market news that might trigger volume spikes. It is particularly useful for confirming trend strength, identifying potential breakouts, and understanding market sentiment. The indicator provides valuable context during volatile market conditions
Keep exploring
What we’ve verified
Access, alerts and repainting behaviour have not been independently verified for this indicator. Check the creator’s current publication and settings.
General descriptions and classifications are recovered research. Verified details above identify the specific checks we have completed. Check the creator’s current publication for later changes.