YOUR INDICATOR RESEARCH STARTS HERE

Find the right indicator.
Understand what it does.

Explore 11,183 indicators. Filter beyond the obvious.
Discover the tools that fit the way you trade.

THE INDICATOR LIBRARY

Results for “VSA”

11,183 tools to explore

28 indicators matching your filters
Save search
VolumeEditor’s pick

Heatmap Volume [xdecow]

by xdecow

A volume heat map indicator that colors volume bars and candles based on the standard deviation of trading volume from its average. Provides visual insights into volume intensity and potential market significance.

Separate pane · unverifiedDay Trading · Swing Trading
Explore
7.2Klikes214.2Kviews107comments
Save
VolumeTrendSignal

VSA Volume Spread Analysis

by traderharikrishna

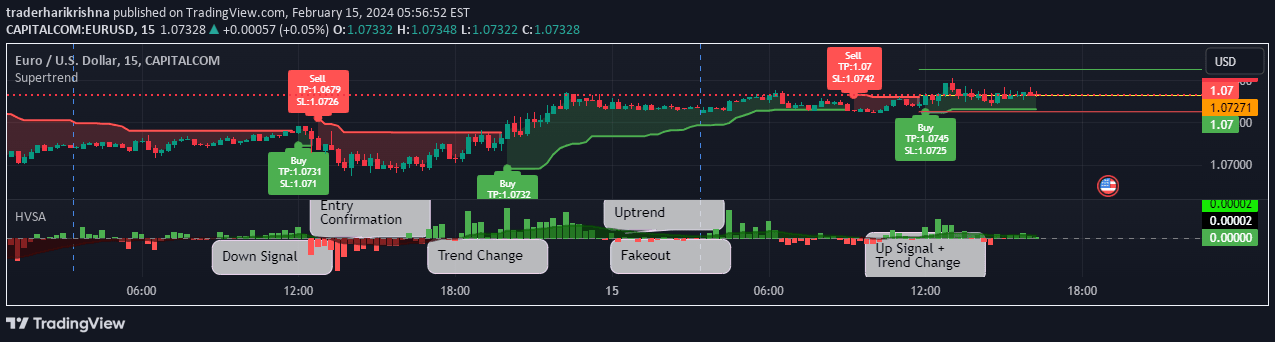
A Volume Spread Analysis indicator that identifies trend direction and volume breakouts by analyzing price, volume changes, and histogram crossovers for potential trading signals.

Separate pane · unverifiedScalping · Day Trading
Explore
801likes21.8Kviews9comments
Save
OscillatorTrendVolume

ADX Volume Trend

by OmegaTools

A modified ADX indicator that integrates volume analysis to determine trend strength and direction with enhanced precision and additional visualization options.

Separate pane · unverifiedScalping · Day Trading
Explore
638likes19.1Kviews12comments
Save
SignalTrendVolume

Volume Spread Analysis [TANHEF]

by TanHef

Volume Spread Analysis indicator helps traders understand market intentions by analyzing volume and price movements through color-coded bars and predictive volume forecasting techniques.

Separate pane · unverifiedScalping · Day Trading
Explore
576likes13.3Kviews23comments
Save
TrendSignalOscillator

RS for VPA

by karthikmarar

A relative strength indicator that compares a stock's performance against an index or reference stock, showing stock strength through an oscillating value around zero with color-coded visualization.

Separate pane · unverifiedDay Trading · Swing Trading
Explore
350likes6.6Kviews3comments
Save
SignalTrendVolume

VPSA-VTD

by CatTheTrader

A volume and price spread analysis tool using normalization and Z-Score techniques to detect market trends, volume dynamics, and potential trading opportunities across different market conditions.

Separate pane · unverifiedScalping · Day Trading
Explore
248likes4.9Kviews3comments
Save
VolumeTrendSignal

Volume Spread Analysis Candle Patterns

by deepu0010

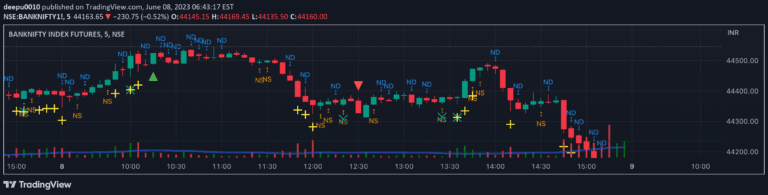
Volume Spread Analysis is a trading methodology that examines the relationship between volume, price spread, and market movement to understand smart money intentions and market sentiment.

Separate pane · unverifiedScalping · Day Trading
Explore
202likes10.1Kviews2comments
Save
SignalVolume

Decoding the Volume of candles

by AlexeyWolf

A volume analysis indicator that highlights candle volumes based on their size and type, helping traders identify market structure, buyer/seller interest, and potential price movement strength.

Separate pane · unverifiedScalping · Day Trading
Explore
191likes4.8Kviews0comments
Save
TrendVolume

Volume Spread Analysis [Ahmed]

by aothmaan

A Volume Spread Analysis (VSA) indicator that examines candle volume and spread to predict price direction, offering insights into market behavior and potential trading opportunities.

Separate pane · unverifiedSwing Trading
Explore
189likes6.2Kviews0comments
Save

Likes, views, and comments are historical TradingView snapshots. They describe attention, not trading performance.

START WITH A QUESTION

A little less searching.
A lot more understanding.

Tell DeepAlpha what you need. Get an explanation, a shortlist,
and a direct path to the indicators behind it.

Ask DeepAlpha