
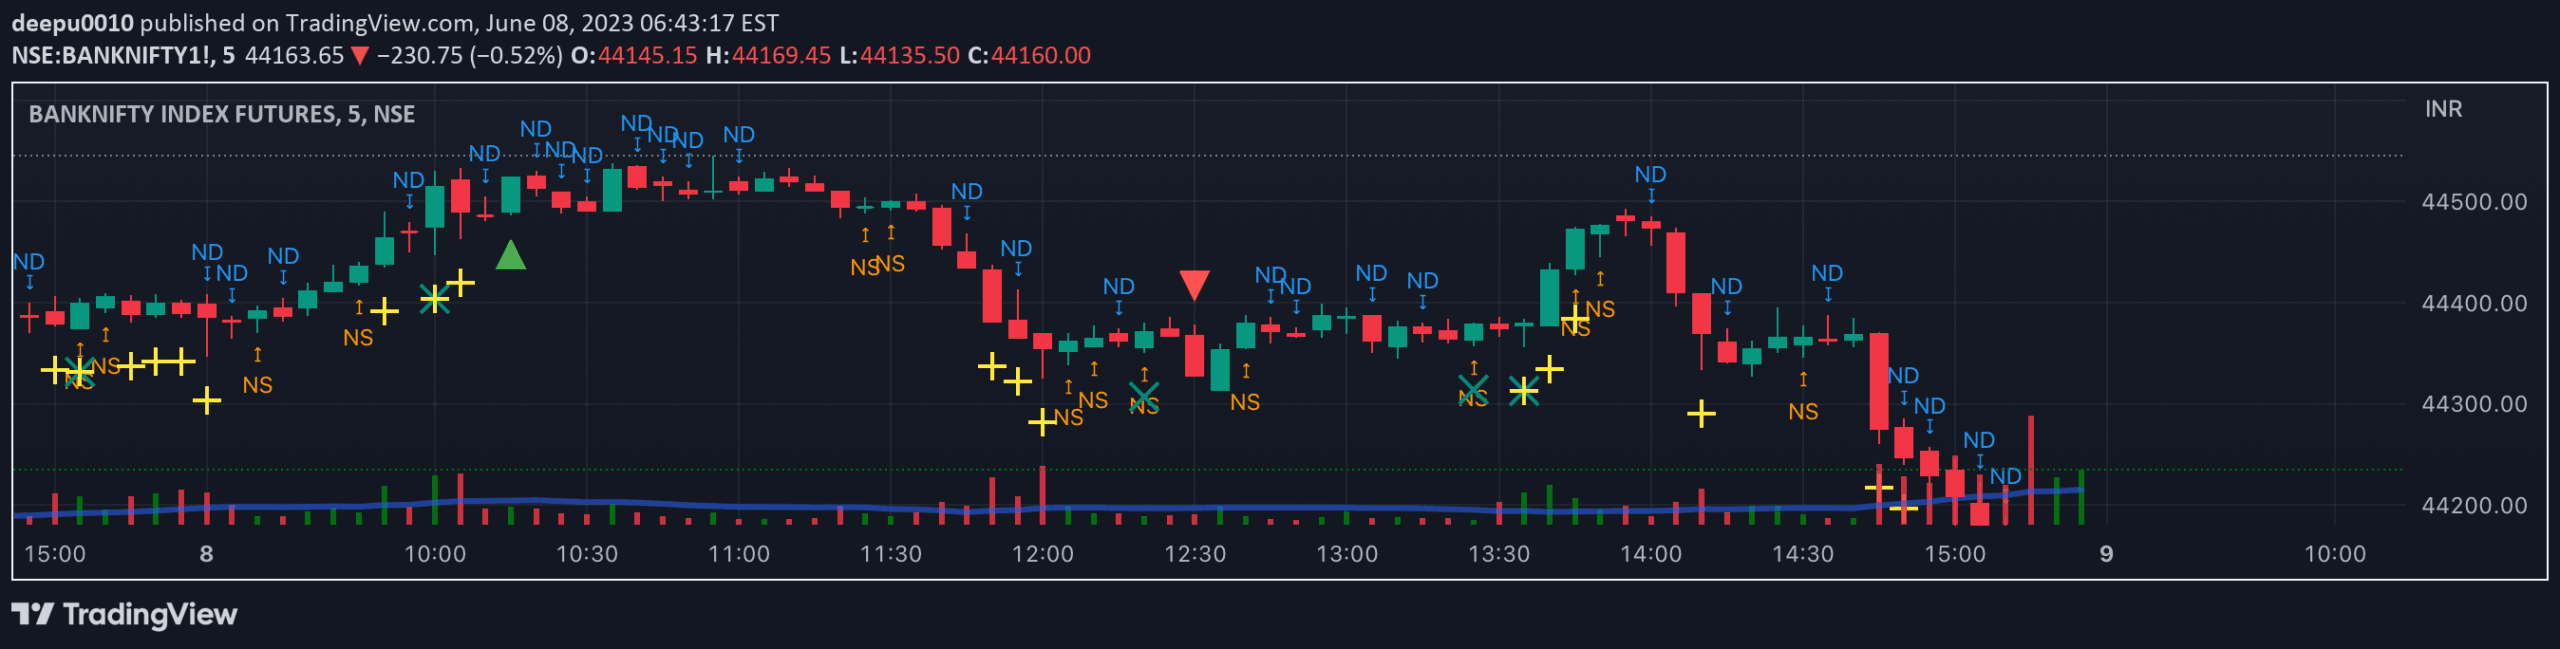
Volume Spread Analysis is a trading methodology that examines the relationship between volume, price spread, and market movement to understand smart money intentions and market sentiment.
Explore complementary indicator rolesHow it works
Volume Spread Analysis (VSA) operates by closely examining the interaction between trading volume and price spread during each trading period. Traders analyze volume levels, price ranges, and how they relate to market behavior, identifying specific patterns like upthrusts, springs, no demand, and no supply scenarios.
The methodology focuses on understanding the underlying intentions of market participants by interpreting volume signals. By tracking how volume changes relative to price movements, VSA practitioners can detect potential market reversals, confirm trend strength, and identify potential entry or exit points in various financial markets.
Why it may be useful
Volume Spread Analysis provides traders with a unique perspective on market dynamics by revealing the hidden intentions of institutional investors and smart money. It offers insights beyond traditional price-based analysis, helping traders understand the psychological and strategic movements of major market participants.
By decoding volume and price interactions, VSA enables traders to make more informed decisions, potentially identifying market turning points and understanding whether current price movements are supported by genuine market interest or represent temporary fluctuations.
When to explore it
Volume Spread Analysis is most effective in markets with sufficient liquidity and trading volume, such as stocks, futures, forex, and cryptocurrencies. Traders can apply VSA during trending and ranging market conditions, using it to confirm potential trend reversals or continuation patterns.
The methodology works best when combined with other technical analysis tools, providing a comprehensive approach to market analysis. Experienced traders often use VSA to validate signals from other indicators, helping to reduce false trading signals and improve overall trading strategy precision.
Keep exploring
What we’ve verified
Access, alerts and repainting behaviour have not been independently verified for this indicator. Check the creator’s current publication and settings.
General descriptions and classifications are recovered research. Verified details above identify the specific checks we have completed. Check the creator’s current publication for later changes.



