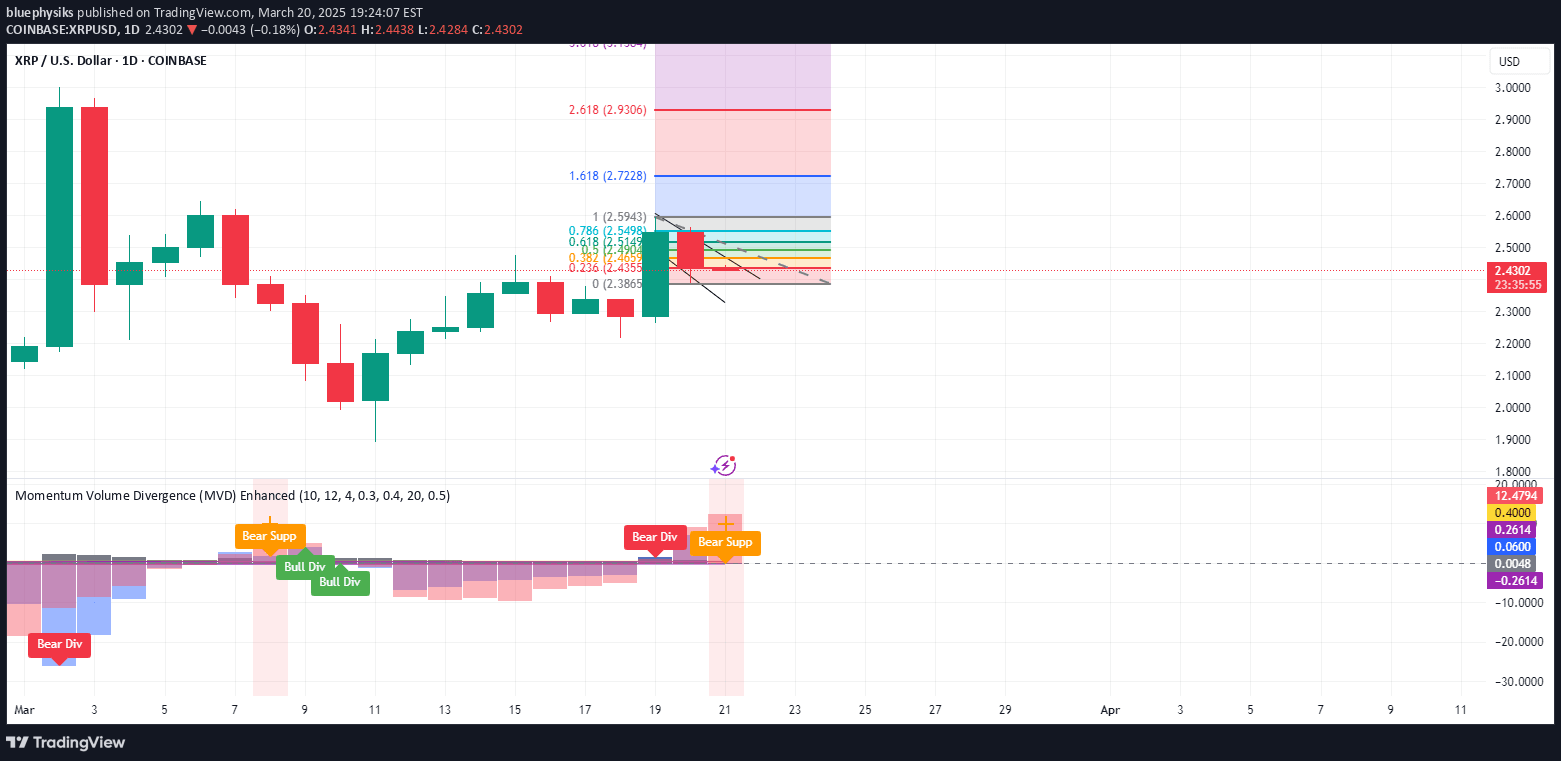
Momentum Volume Divergence (MVD) Enhanced is an advanced indicator for XRP that detects price-momentum divergences and momentum suppression, providing clear visual signals for potential trend reversals.
Explore complementary indicator rolesHow it works
The indicator calculates volume-weighted momentum by analyzing the relationship between price movement and trading volume. It uses dynamic lookbacks and ATR-adjusted thresholds to identify divergences.
The blue momentum line represents bullish or bearish momentum, with zero as the neutral point. Triangles and crosses mark potential reversal points, with green triangles signaling bullish opportunities and red triangles indicating bearish scenarios
Why it may be useful
This indicator helps traders identify potential trend reversals by revealing discrepancies between price action and underlying momentum. It provides visual cues that can highlight weakening trends before they become apparent in price movement.
By combining volume analysis with momentum indicators, traders can gain insights into market psychology and potential trend changes. The tool offers multiple signal types to help traders make more informed trading decisions
When to explore it
The MVD Enhanced works best on daily charts for XRP, particularly during periods of clear market trends. It is most effective when used in conjunction with other technical analysis tools and price action confirmation. Traders should avoid using it during periods of low volatility or choppy market conditions. The indicator is particularly useful for swing traders looking to identify potential entry and exit points
Keep exploring
What we’ve verified
Access, alerts and repainting behaviour have not been independently verified for this indicator. Check the creator’s current publication and settings.
General descriptions and classifications are recovered research. Verified details above identify the specific checks we have completed. Check the creator’s current publication for later changes.