A trading signal that detects market reversals by analyzing price, volume, and RSI divergences to identify potential trend changes and trading opportunities.
Explore complementary indicator rolesHow it works
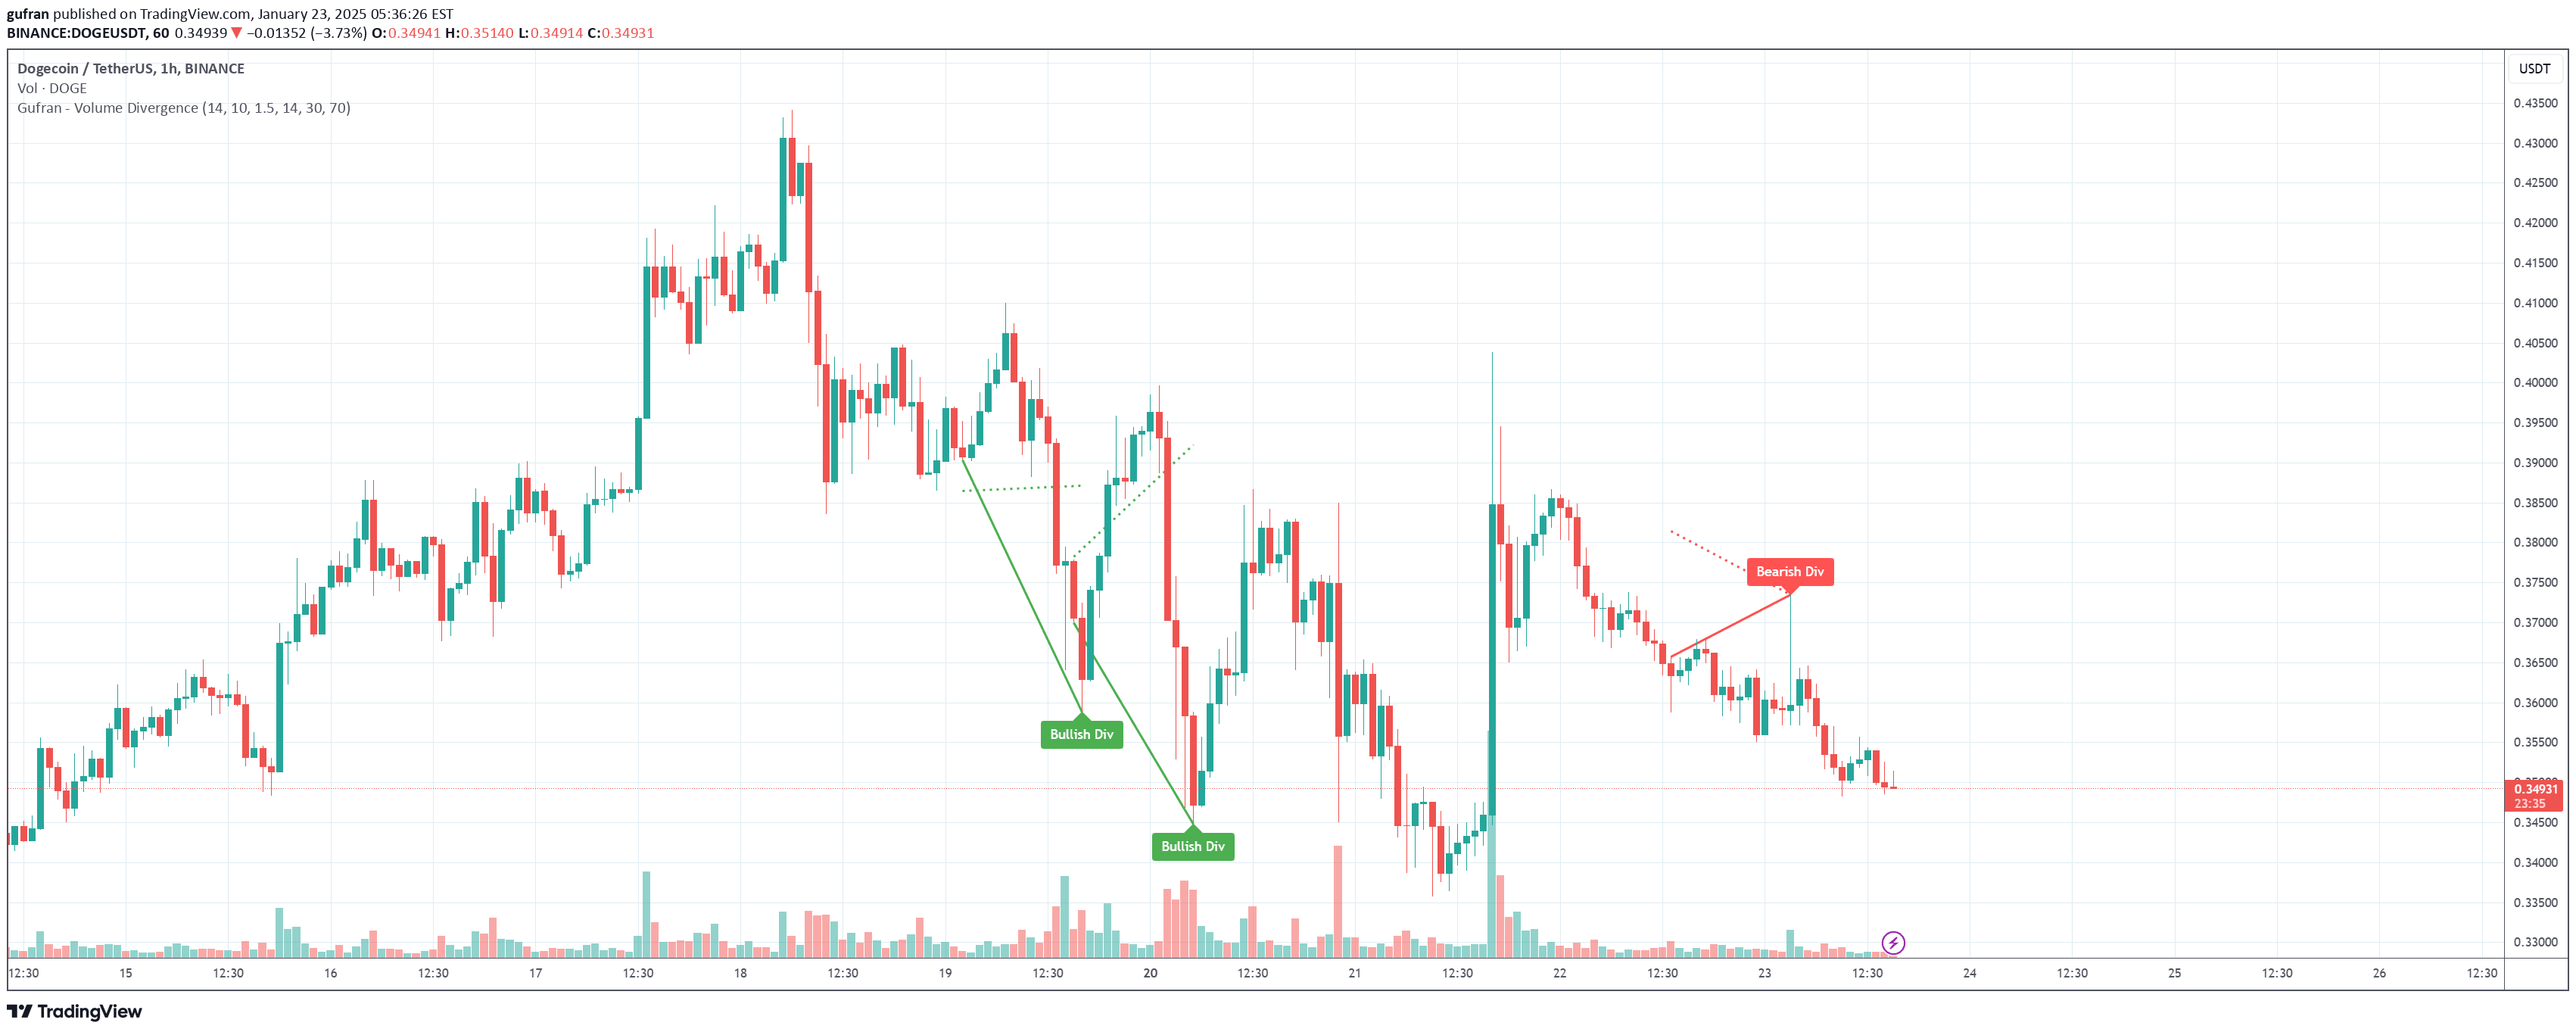
The divergence indicator tracks price action and volume trends to identify potential market reversals. It compares price movements with volume dynamics and RSI levels to detect discrepancies that might signal upcoming trend changes.
When price makes a lower low but volume shows higher lows, it suggests a potential bullish divergence. Conversely, when price creates a higher high while volume indicates lower highs, it signals a potential bearish divergence. The indicator then cross-references these findings with RSI levels to confirm signal reliability.
Why it may be useful
This signal provides traders with a nuanced view of market momentum by integrating multiple technical analysis components. By combining price, volume, and RSI data, it offers a more comprehensive approach to identifying potential trend reversals than single-indicator methods.
The divergence indicator helps traders recognize hidden market dynamics that might not be immediately apparent from price action alone. It allows for more informed decision-making by highlighting subtle shifts in market sentiment and providing early warning signs of potential trend changes.
When to explore it
The divergence indicator works best in markets with clear trending characteristics and sufficient trading volume. It is particularly effective during periods of potential trend exhaustion or when price movements seem to be losing momentum.
Traders should use this signal in conjunction with other technical analysis tools and consider the broader market context. It is most reliable when applied to liquid markets and timeframes that allow for meaningful volume and RSI analysis.
Keep exploring
What we’ve verified
Access, alerts and repainting behaviour have not been independently verified for this indicator. Check the creator’s current publication and settings.
General descriptions and classifications are recovered research. Verified details above identify the specific checks we have completed. Check the creator’s current publication for later changes.