Support and Resistance (MTF) | Flux Charts
A multi-timeframe support and resistance indicator that identifies key price zones, tracks breaks and retests, and provides comprehensive market trend analysis for traders.
Explore 11,183 indicators. Filter beyond the obvious.
Discover the tools that fit the way you trade.
11,183 tools to explore
A multi-timeframe support and resistance indicator that identifies key price zones, tracks breaks and retests, and provides comprehensive market trend analysis for traders.
A trading script that identifies breakout and retest signals by analyzing pivot points, highlighting key price levels with dynamic boxes and volume confirmation.
A scalping indicator that identifies volume breakouts and price movements to generate trading signals based on volume increase, price change, and market trend confirmation.
A trading script that detects range-bound market conditions and breakout signals by analyzing volatility compression and volume imbalance across different market timeframes.
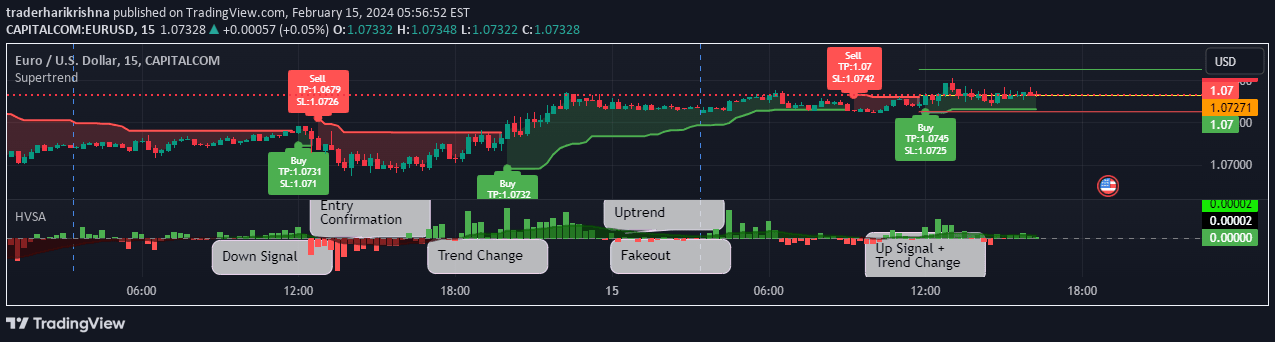
A Volume Spread Analysis indicator that identifies trend direction and volume breakouts by analyzing price, volume changes, and histogram crossovers for potential trading signals.
A trading strategy identifying potential long entry opportunities by analyzing volume, price movements, and technical indicators to spot high-probability stock trades.
A specialized indicator that detects high-volume trading bars by comparing current volume against a moving average and customizable volume multiplier settings.
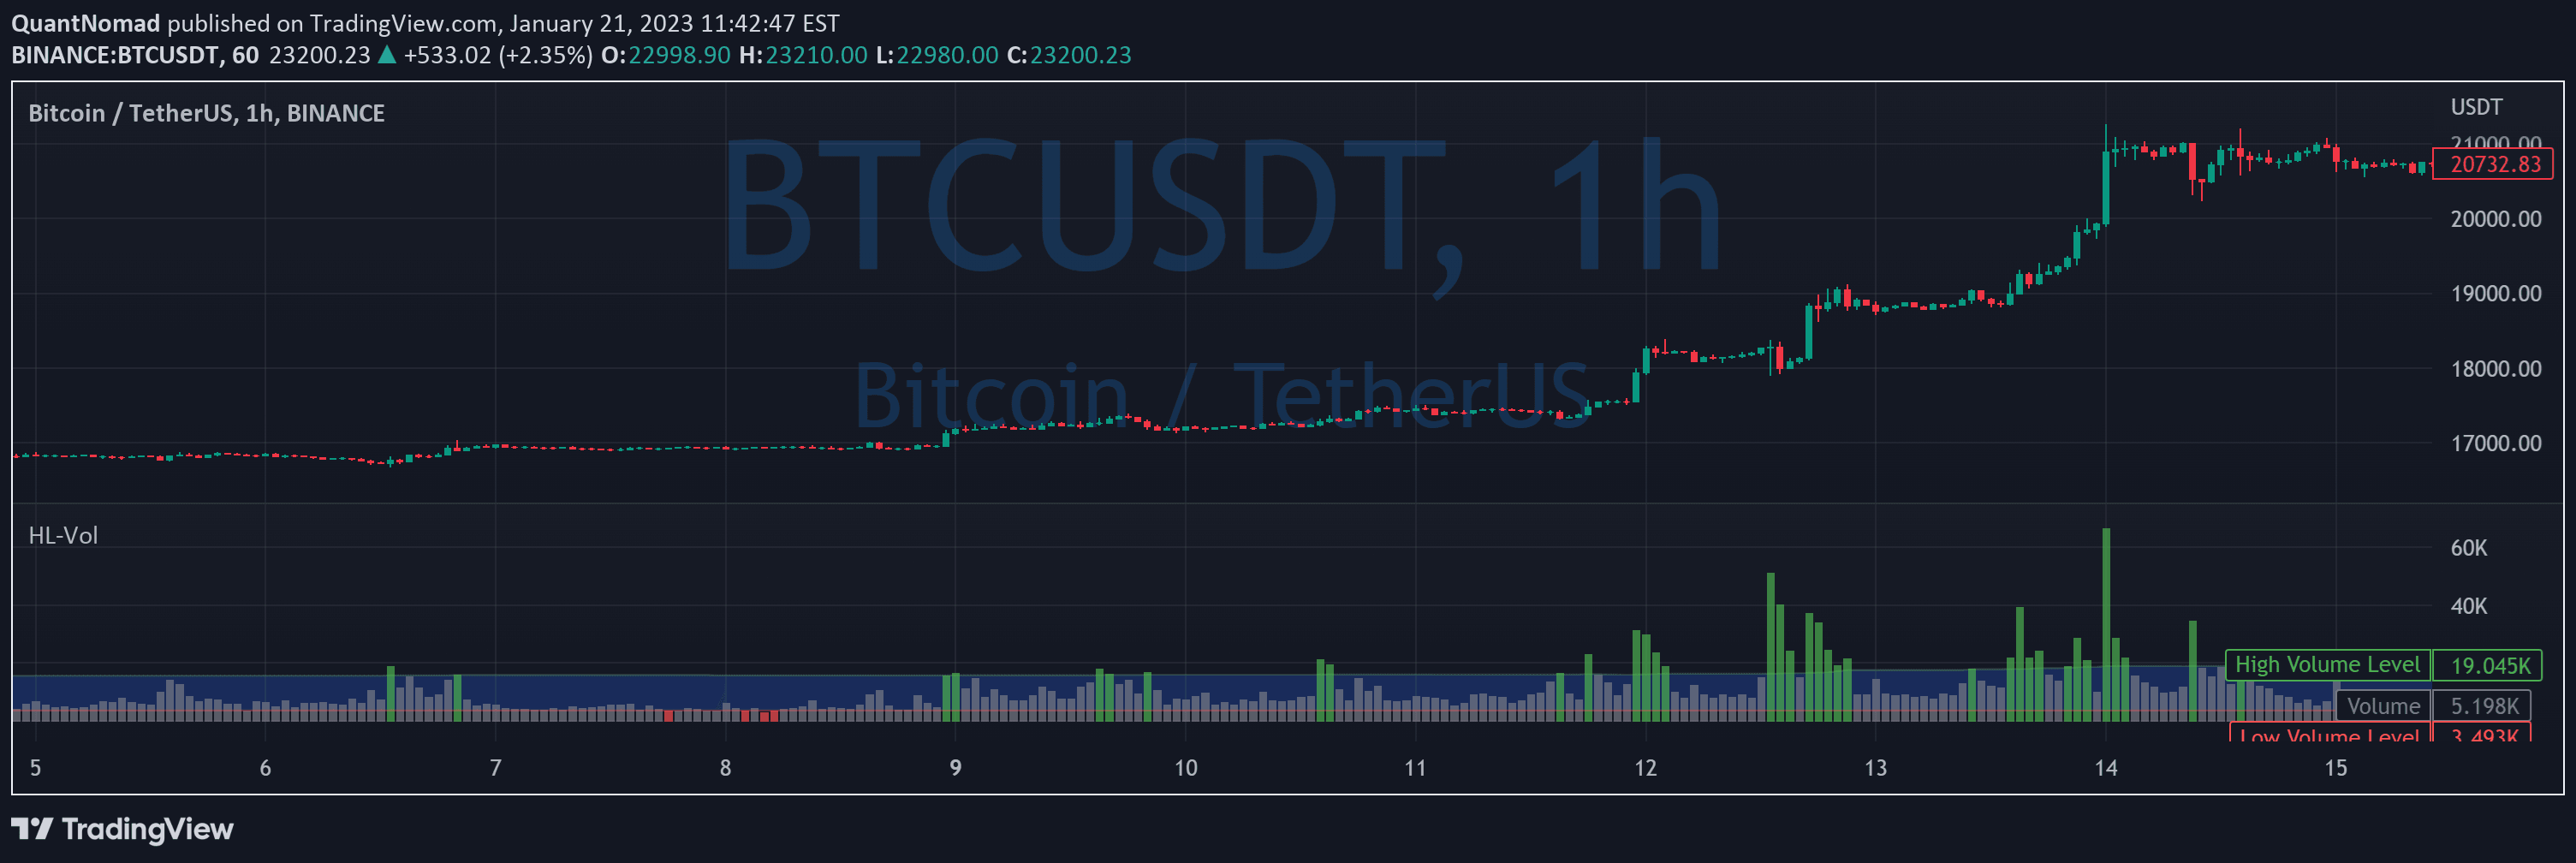
A dynamic volume indicator that calculates high and low levels using percentiles or standard deviations, helping traders identify unusual volume events adaptively.
The Relative Volume / Volume Breakout Multiplier (RVI) helps traders analyze volume dynamics by quantifying volume breakouts relative to the Simple Moving Average.
A volume-based indicator that highlights the most active trading candles, helping traders identify significant market moments with color-coded volume visualization.
A volume-based trading indicator that highlights high volume candles in Nifty and BankNifty indices, helping traders identify potential significant market movements by filtering noise.
Volume-Weighted RSI combines price and volume data to create a more nuanced momentum indicator that reveals potential price and volume anomalies.
Likes, views, and comments are historical TradingView snapshots. They describe attention, not trading performance.