Monthly Returns in PineScript Strategies
A custom trading tool that generates monthly and yearly performance tables for trading strategies, helping traders analyze historical strategy performance and identify key periods of success or weakness.
Explore 11,183 indicators. Filter beyond the obvious.
Discover the tools that fit the way you trade.
11,183 tools to explore
A custom trading tool that generates monthly and yearly performance tables for trading strategies, helping traders analyze historical strategy performance and identify key periods of success or weakness.
A script for quickly analyzing trading signals by computing performance metrics across different stop-loss and take-profit configurations using SuperTrend signals.
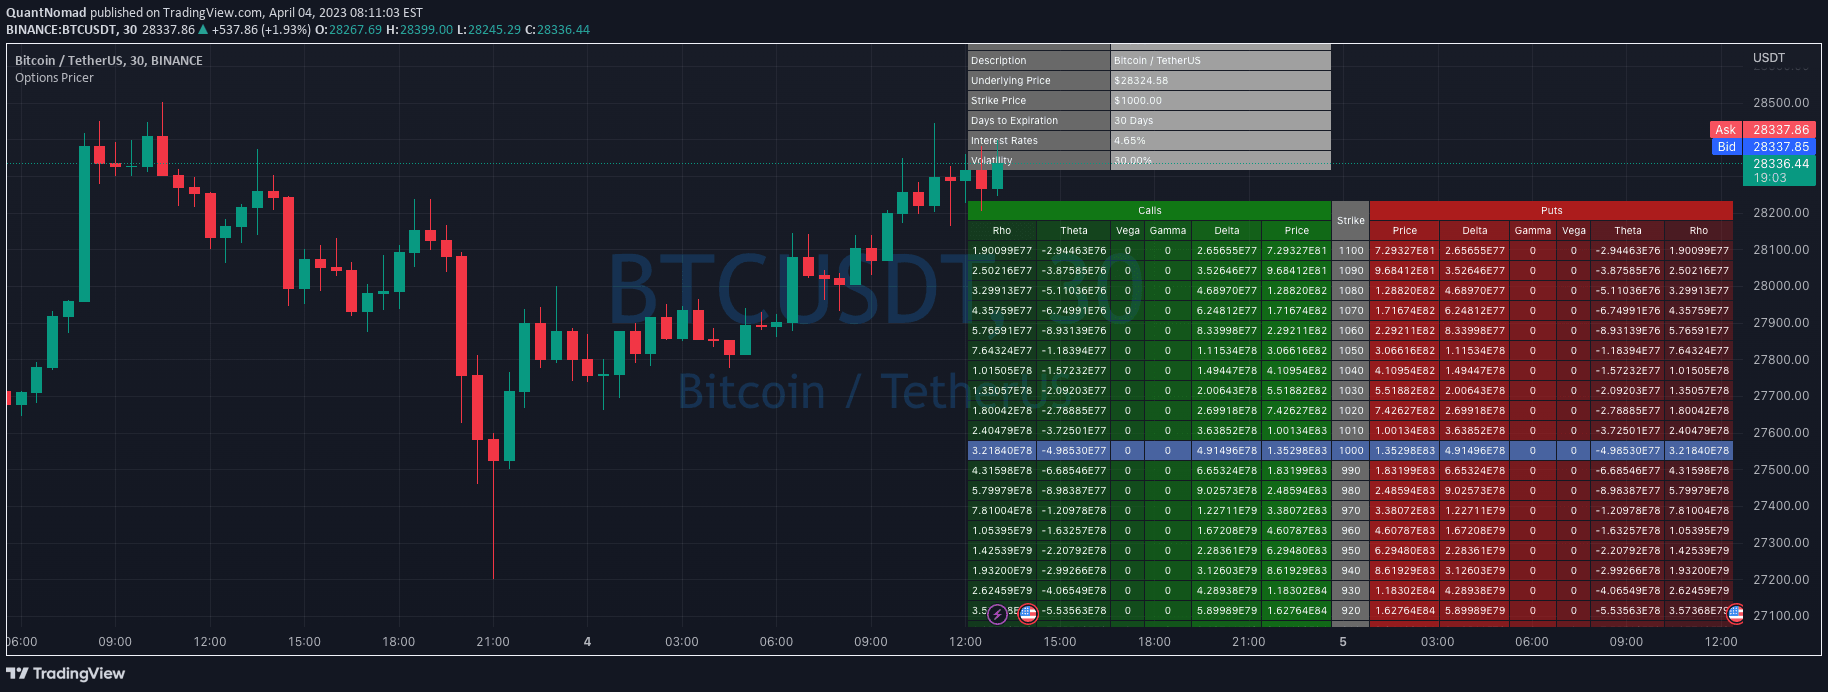
A TradingView option pricing tool that computes option prices and greeks for both put and call options using strikes, implied volatility, and days to expiry.
A comprehensive trading script enabling portfolio management and performance analysis with customizable settings for instrument selection, capital allocation, and benchmark comparison.
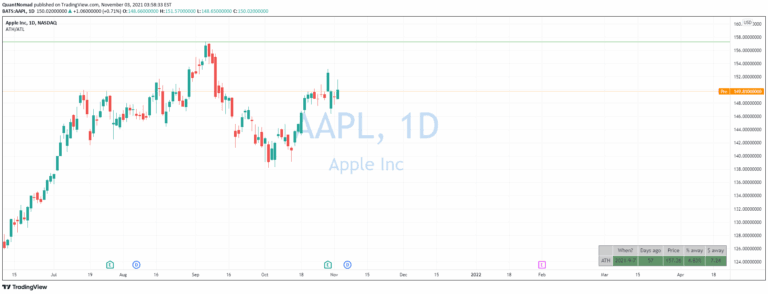
A widget that tracks all-time high and all-time low price levels, providing traders with insights into historical price extremes and potential breakout opportunities.
A custom logging utility for Pine Script traders to track and debug complex trading indicators by storing messages with timestamps and types for easier code development and analysis.
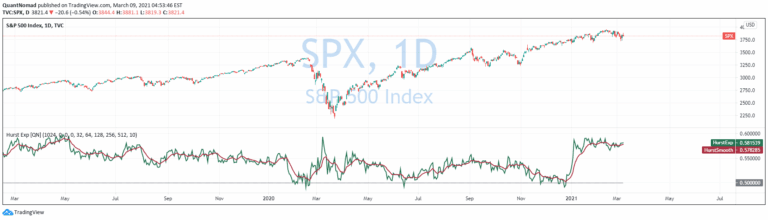
The Hurst Exponent is a statistical measure that evaluates time series behavior, helping traders identify market trends, mean reversion, and potential future price movements.
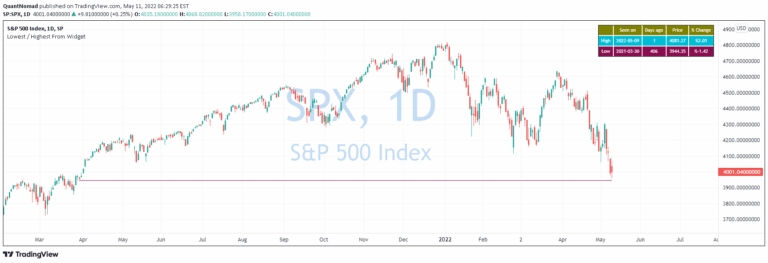
A widget that identifies the most recent day when price was higher or lower than the current value, visualizing historical price comparisons through lines and informative tables.
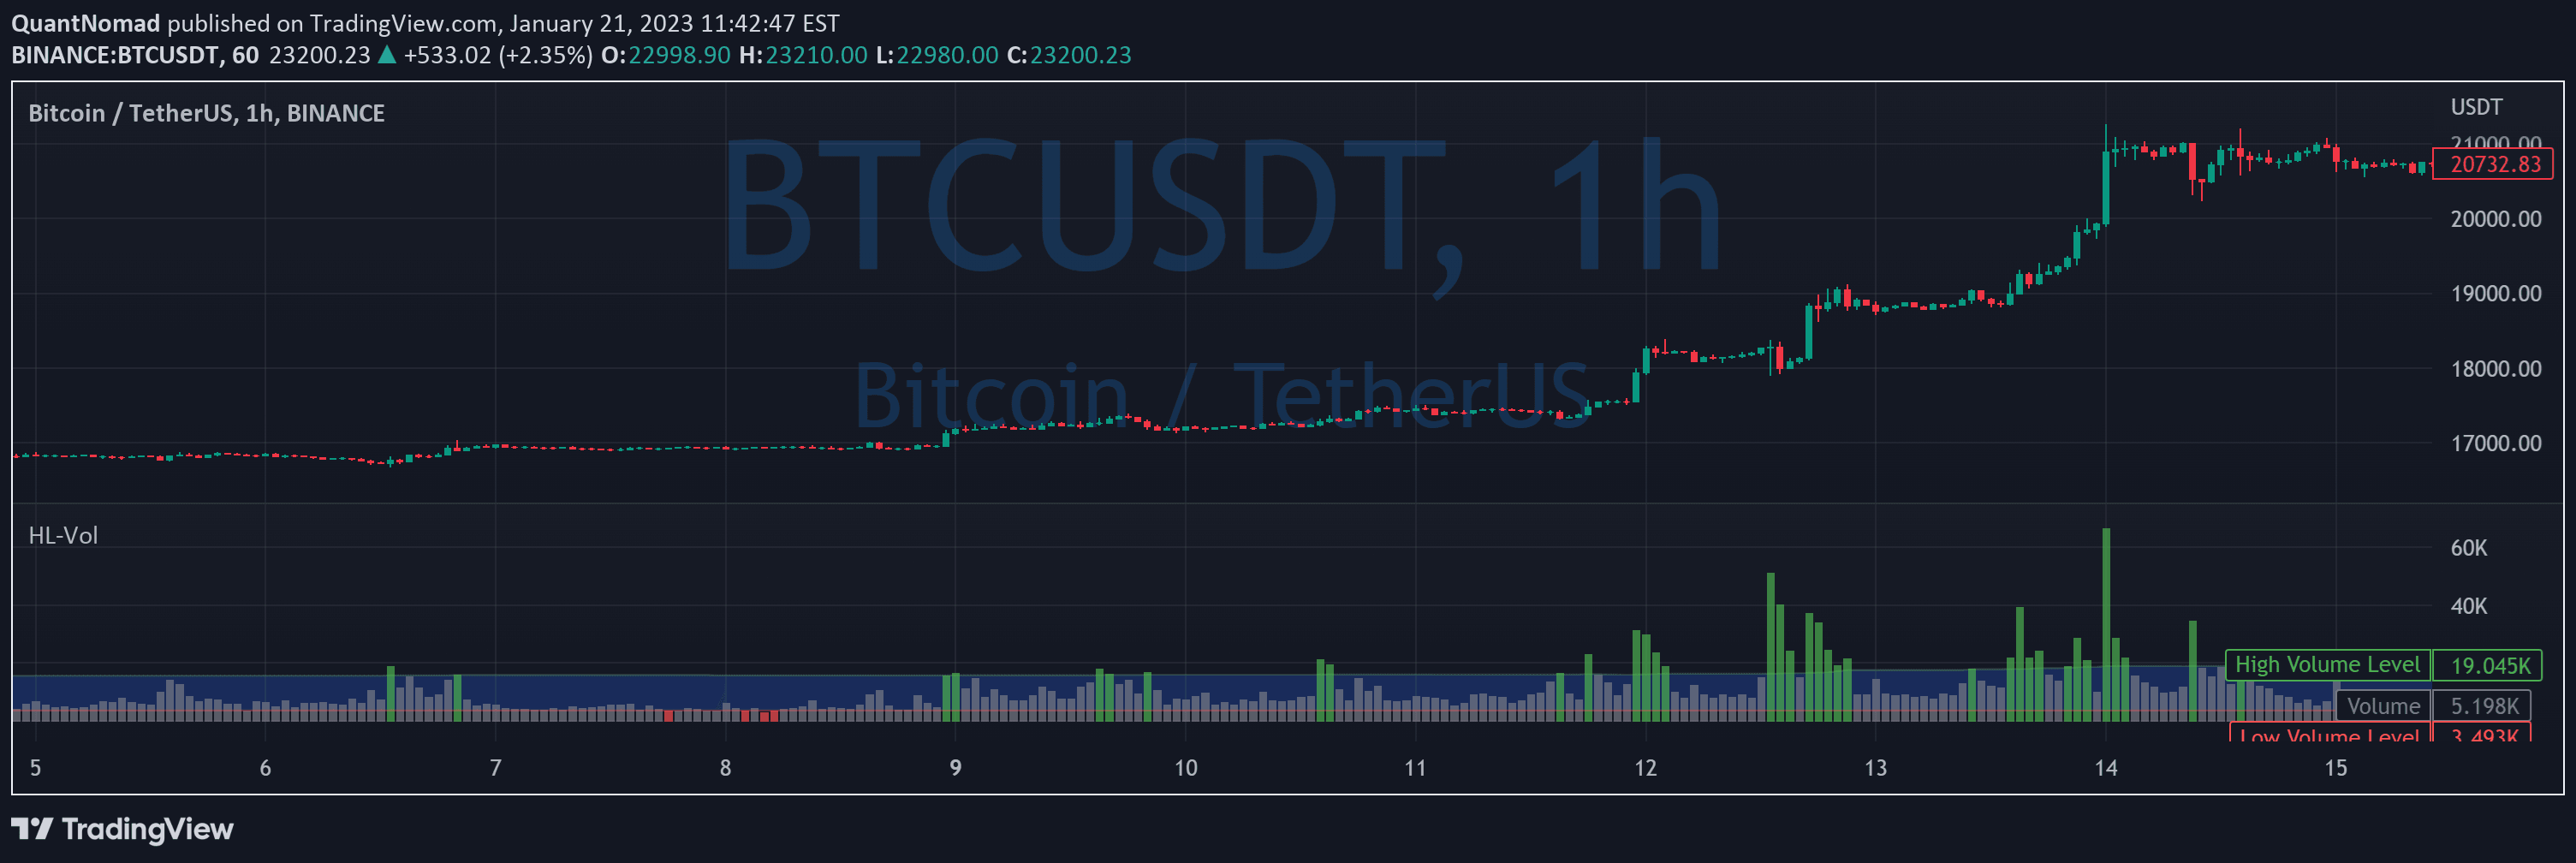
A dynamic volume indicator that calculates high and low levels using percentiles or standard deviations, helping traders identify unusual volume events adaptively.
A dynamic probability indicator that estimates the likelihood of price closing above or below specified levels within a current trading bar, helping traders make informed decisions.
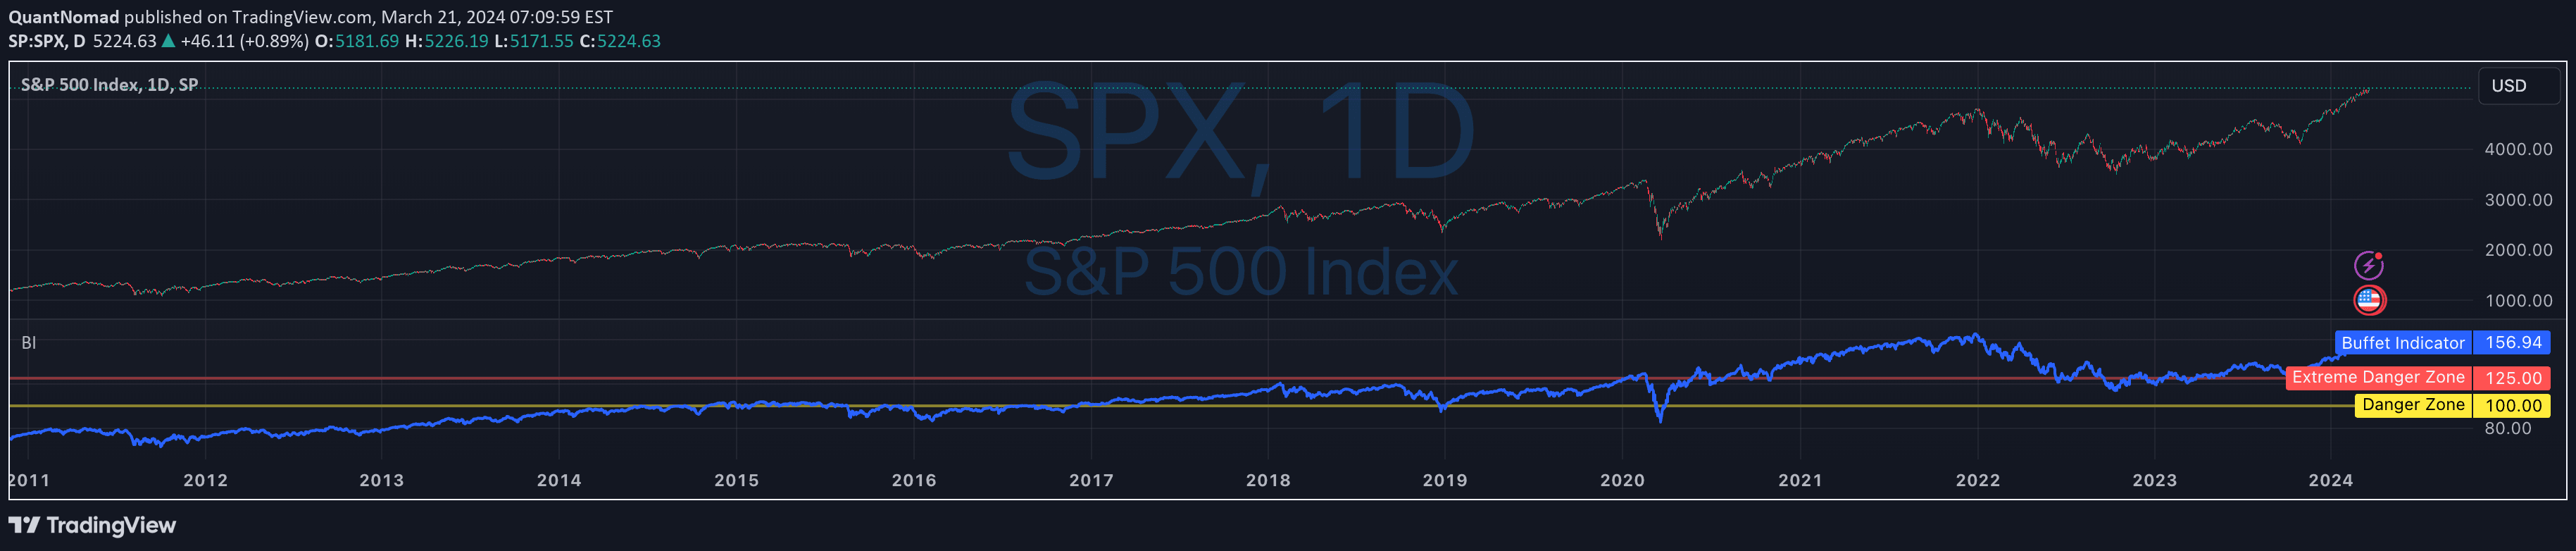
A market valuation indicator comparing total stock market capitalization to US GDP, providing insight into potential market overvaluation or undervaluation.
A Simple Moving Average (SMA) based indicator that generates trading signals by tracking crossovers across multiple financial instruments using automated alerts.
Likes, views, and comments are historical TradingView snapshots. They describe attention, not trading performance.