
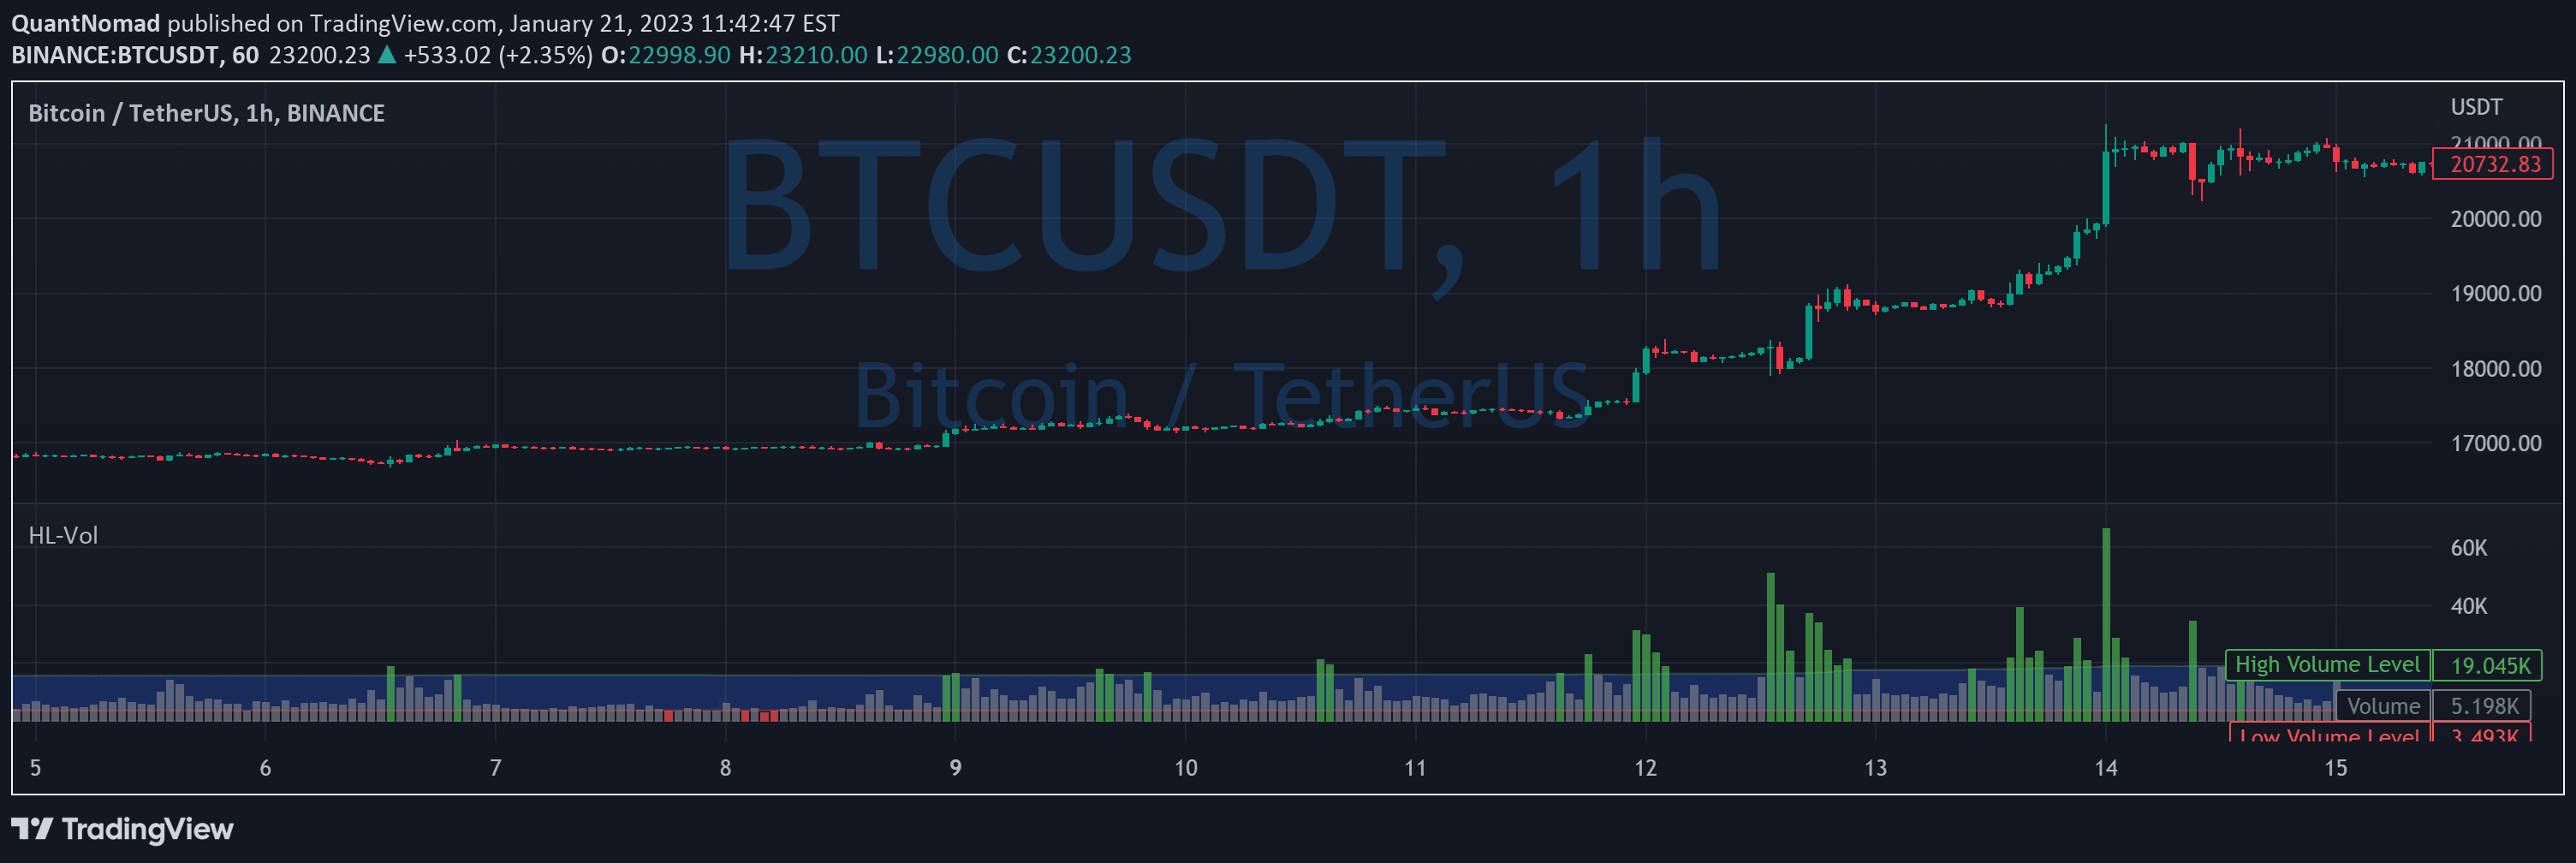
A dynamic volume indicator that calculates high and low levels using percentiles or standard deviations, helping traders identify unusual volume events adaptively.
Explore complementary indicator rolesHow it works
The indicator computes dynamic volume thresholds using two primary methods: percentiles and standard deviations (sigma). For percentile calculation, it looks back at a specified number of bars and determines values at specific percentile levels, such as 5% for low and 95% for high volume levels.
With sigma method, the indicator assumes a normal distribution of volume data and calculates levels based on standard deviations from the mean. Values beyond two standard deviations are considered rare and extreme events, providing traders with a flexible way to identify unusual volume patterns across different market conditions.
Why it may be useful
Traditional volume indicators often use static or absolute levels that fail to adapt to changing market dynamics, making them less responsive to evolving trading environments. This approach provides a more nuanced and contextual understanding of volume by dynamically adjusting thresholds based on recent market behavior.
By offering flexible measurement techniques like percentiles and sigma, traders can more accurately identify unexpected volume events that might signal potential trend changes, breakouts, or significant market movements. The method helps traders filter out noise and focus on truly meaningful volume anomalies.
When to explore it
This volume indicator is most effective in markets with variable trading activity where static volume thresholds become less meaningful. It works particularly well for active traders who need to quickly identify unusual volume patterns across different timeframes and market conditions.
Traders can optimize the indicator by carefully selecting lookback periods and percentile/sigma levels that match their specific trading style and the characteristics of the financial instrument they're analyzing. It's especially useful during periods of market transition, earnings announcements, or significant economic events.
Keep exploring
What we’ve verified
Access, alerts and repainting behaviour have not been independently verified for this indicator. Check the creator’s current publication and settings.
General descriptions and classifications are recovered research. Verified details above identify the specific checks we have completed. Check the creator’s current publication for later changes.




