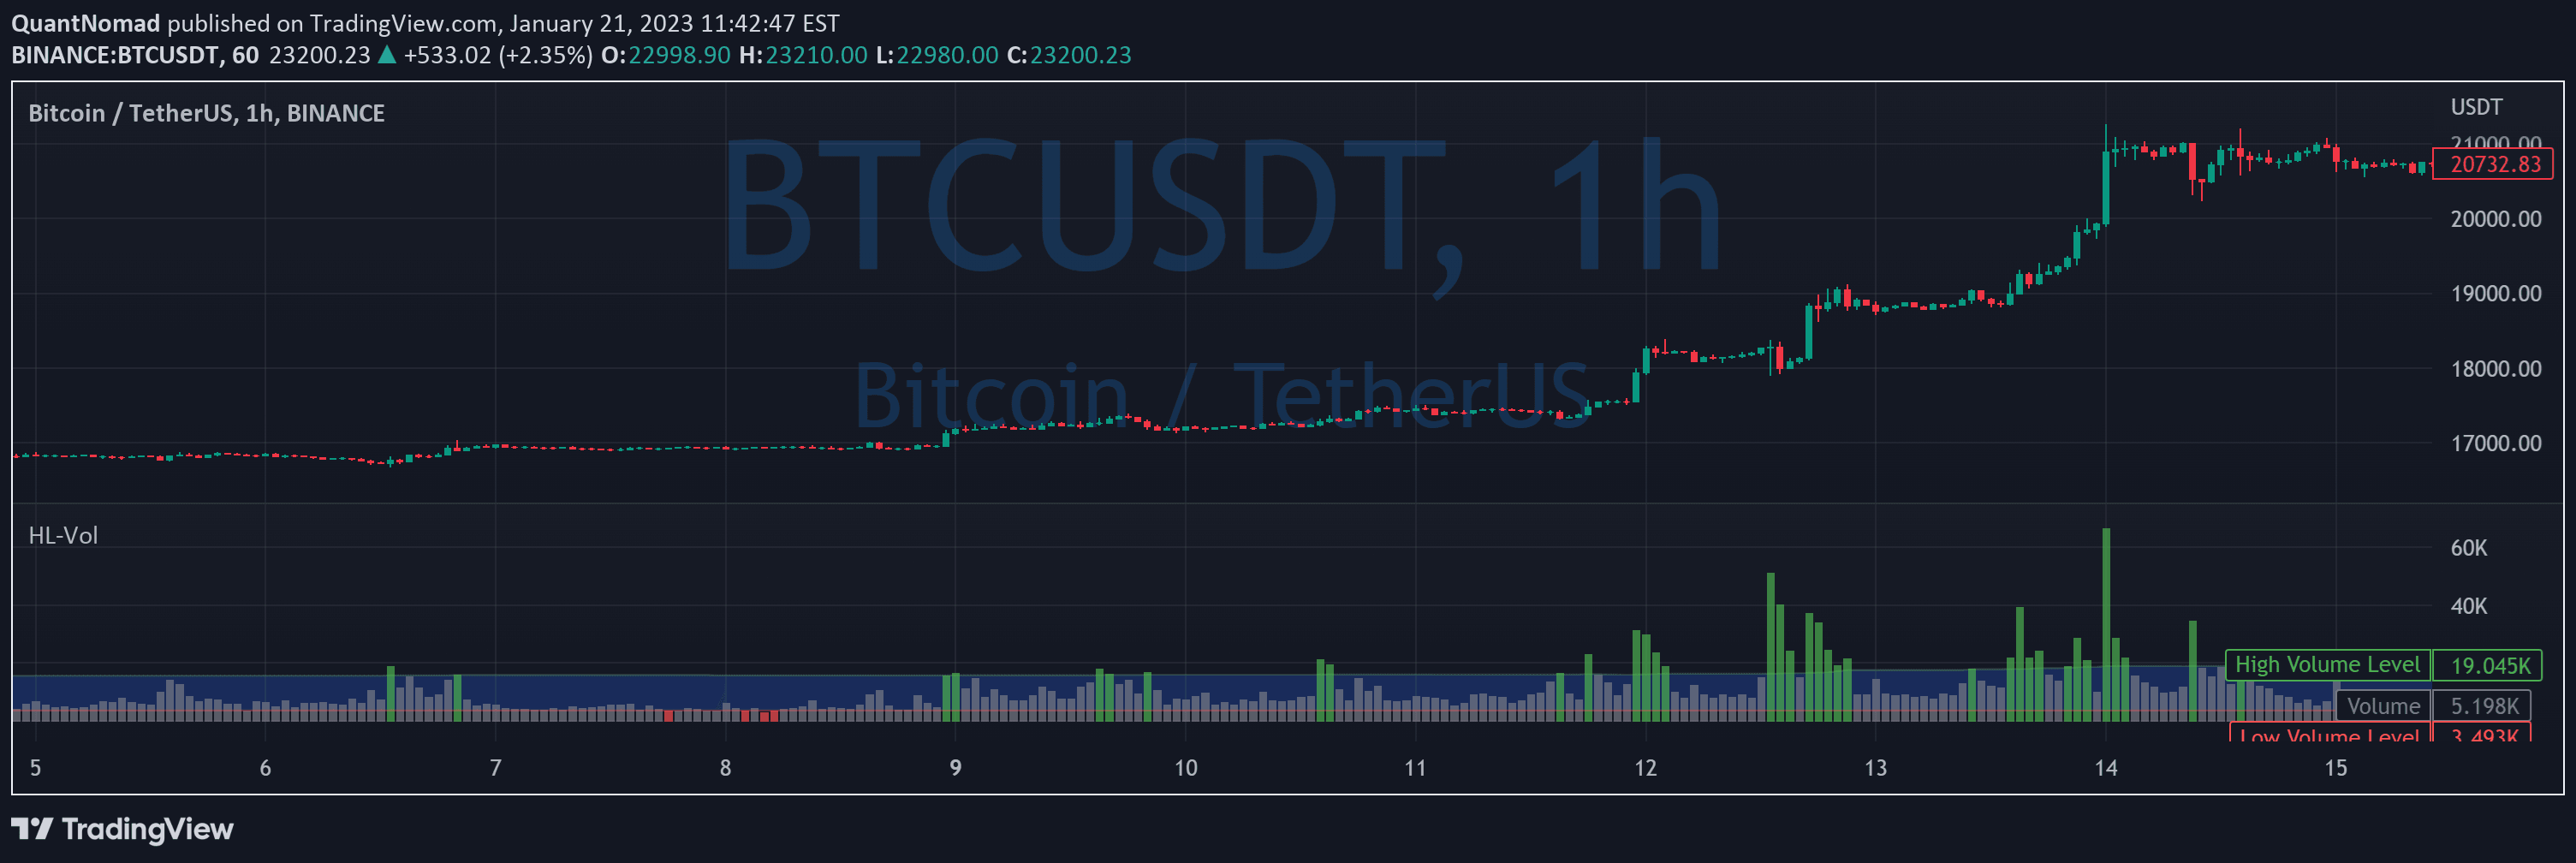
The Relative Volume / Volume Breakout Multiplier (RVI) helps traders analyze volume dynamics by quantifying volume breakouts relative to the Simple Moving Average.
Explore complementary indicator rolesHow it works
The Relative Volume Indicator (RVI) calculates volume breakouts by comparing current trading volume to its Simple Moving Average (SMA). When the current volume exceeds the SMA, the indicator generates a multiplier greater than 1.0, signaling increased trading activity and potential market momentum.
If the volume is below the SMA, the multiplier drops below 1.0, indicating reduced trading volume. Traders can quickly interpret these multipliers to understand volume dynamics. A multiplier of 2.0 means current volume is double the SMA, while 0.50 indicates volume is half the average. This provides traders with an instant visual representation of volume strength and potential market movement.
Why it may be useful
Volume is a critical component in understanding market dynamics, and the RVI offers traders a precise tool for analyzing trading activity. By quantifying volume relative to its moving average, traders can gain insights into potential trend confirmations, breakouts, and market sentiment. This indicator helps distinguish between genuine market movements and potential false signals.
The RVI's strength lies in its ability to provide context to trading volume, allowing traders to make more informed decisions. It helps identify periods of increased market participation and potential trend reversals, making it a valuable tool for traders seeking to understand the underlying strength of price movements.
When to explore it
The RVI is most effective during periods of potential market breakouts, trend reversals, and significant price movements. Traders can use this indicator to confirm the strength of a trend or identify potential entry and exit points based on volume dynamics. It is particularly useful in volatile markets where volume can provide critical insights into market sentiment.
Breakout traders will find the RVI especially valuable, as it helps validate the significance of price movements by revealing the corresponding volume strength. By comparing current volume to its historical average, traders can distinguish between meaningful market moves and potential noise, enhancing their trading strategy's precision and reliability.
Keep exploring
What we’ve verified
Access, alerts and repainting behaviour have not been independently verified for this indicator. Check the creator’s current publication and settings.
General descriptions and classifications are recovered research. Verified details above identify the specific checks we have completed. Check the creator’s current publication for later changes.