Order Blocks | Flux Charts
A specialized indicator that identifies and visualizes order blocks with volumetric information, helping traders understand market order concentrations and potential price reversal zones.
Explore 11,183 indicators. Filter beyond the obvious.
Discover the tools that fit the way you trade.
11,183 tools to explore
A specialized indicator that identifies and visualizes order blocks with volumetric information, helping traders understand market order concentrations and potential price reversal zones.
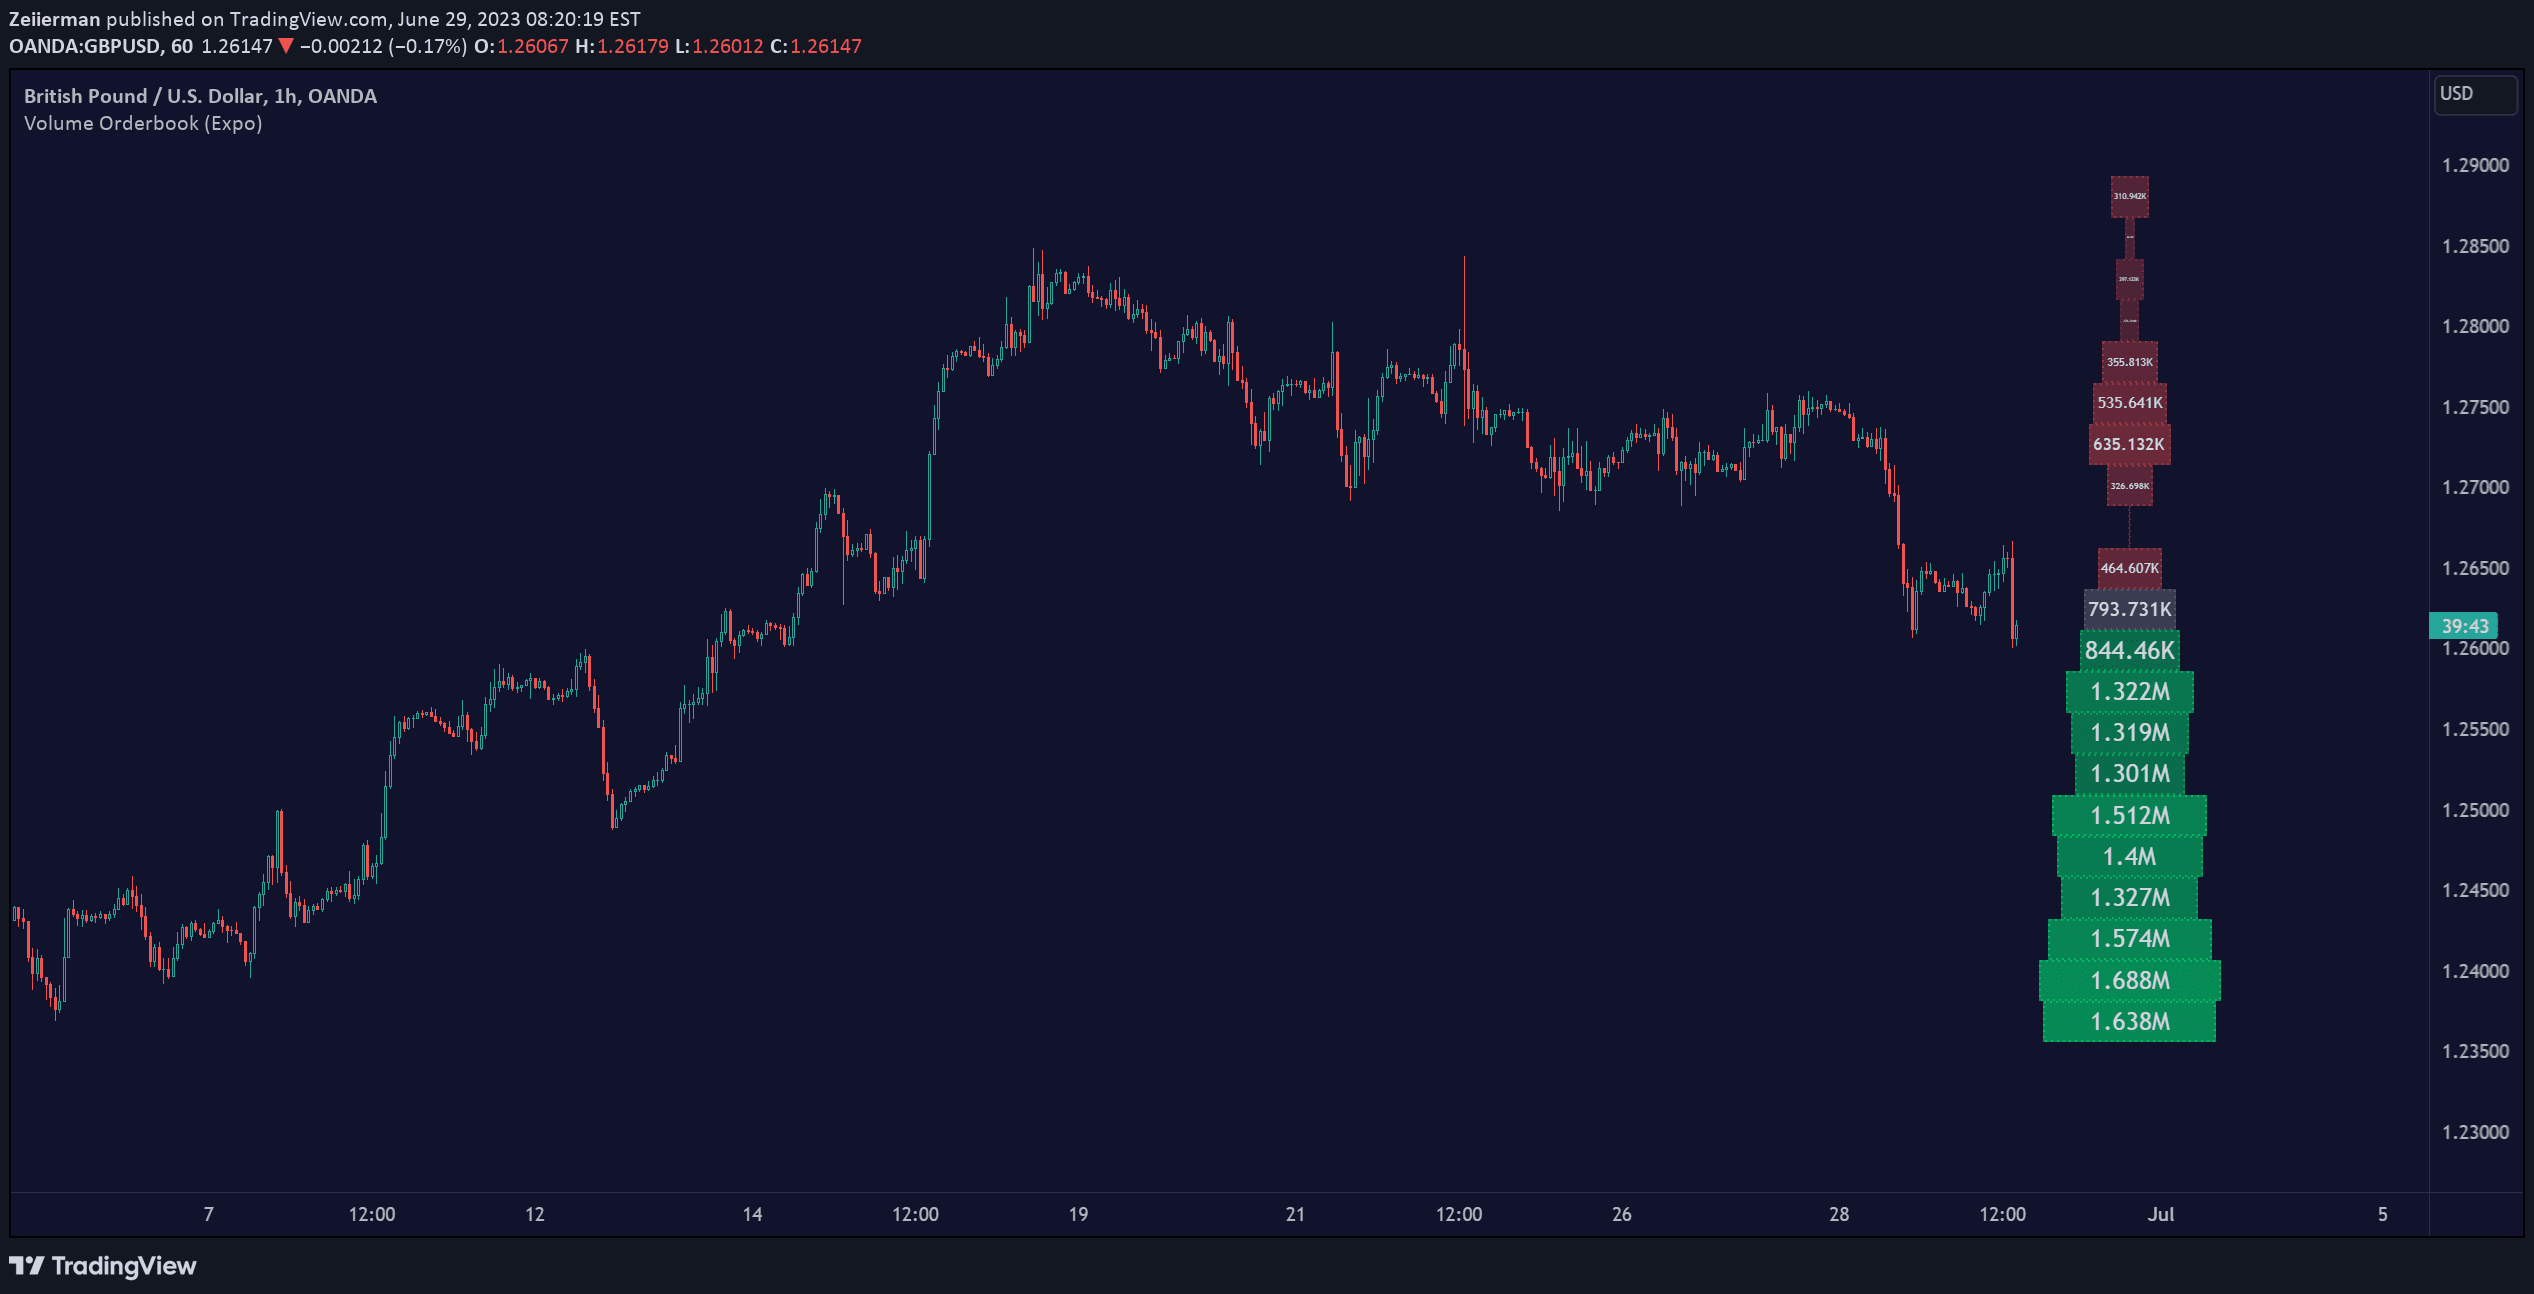
Volume Orderbook is a visual trading tool that displays trading volume across different price levels, helping traders identify significant market activity zones and potential support/resistance areas.
A volume profile charting tool that visualizes trading volume distribution across price levels, detecting significant volume nodes and clusters for strategic trading insights.
A comprehensive market analysis tool tracking price frequency and trading volume to reveal market dynamics, support/resistance levels, and fair value zones.
A volume heatmap indicator that identifies price levels with the most trading volume, helping traders find key market activity zones and potential value trading targets.
Advanced volume analysis tool that creates a heatmap and volume profile, providing detailed insights into trading volume, price movements, and market structure across different time frames.
A volume-based indicator that highlights key liquidity zones by detecting high-volume pivots and visualizing market activity through dynamic markers and support/resistance levels.
A signal that identifies potential liquidation price levels where highly leveraged traders' positions may be forcibly closed, revealing key market support and resistance zones.
A trading tool that visualizes candle bodies with the highest volume on a lower timeframe, highlighting areas of significant market activity using color-coded heatmaps and interval lines.
Volume Order Blocks is a powerful trading indicator that identifies significant order blocks using EMA crossovers, volume analysis, and price structure to highlight key supply and demand zones.
Advanced volume profile indicator offering high-resolution analysis of trading volume across multiple range modes, providing traders with detailed insights into market structure and price-volume relationships.
The SMI MFI combines Stochastic Momentum Index and Money Flow Index to measure price momentum and buying/selling pressure, providing insights into market direction and strength.
Likes, views, and comments are historical TradingView snapshots. They describe attention, not trading performance.