
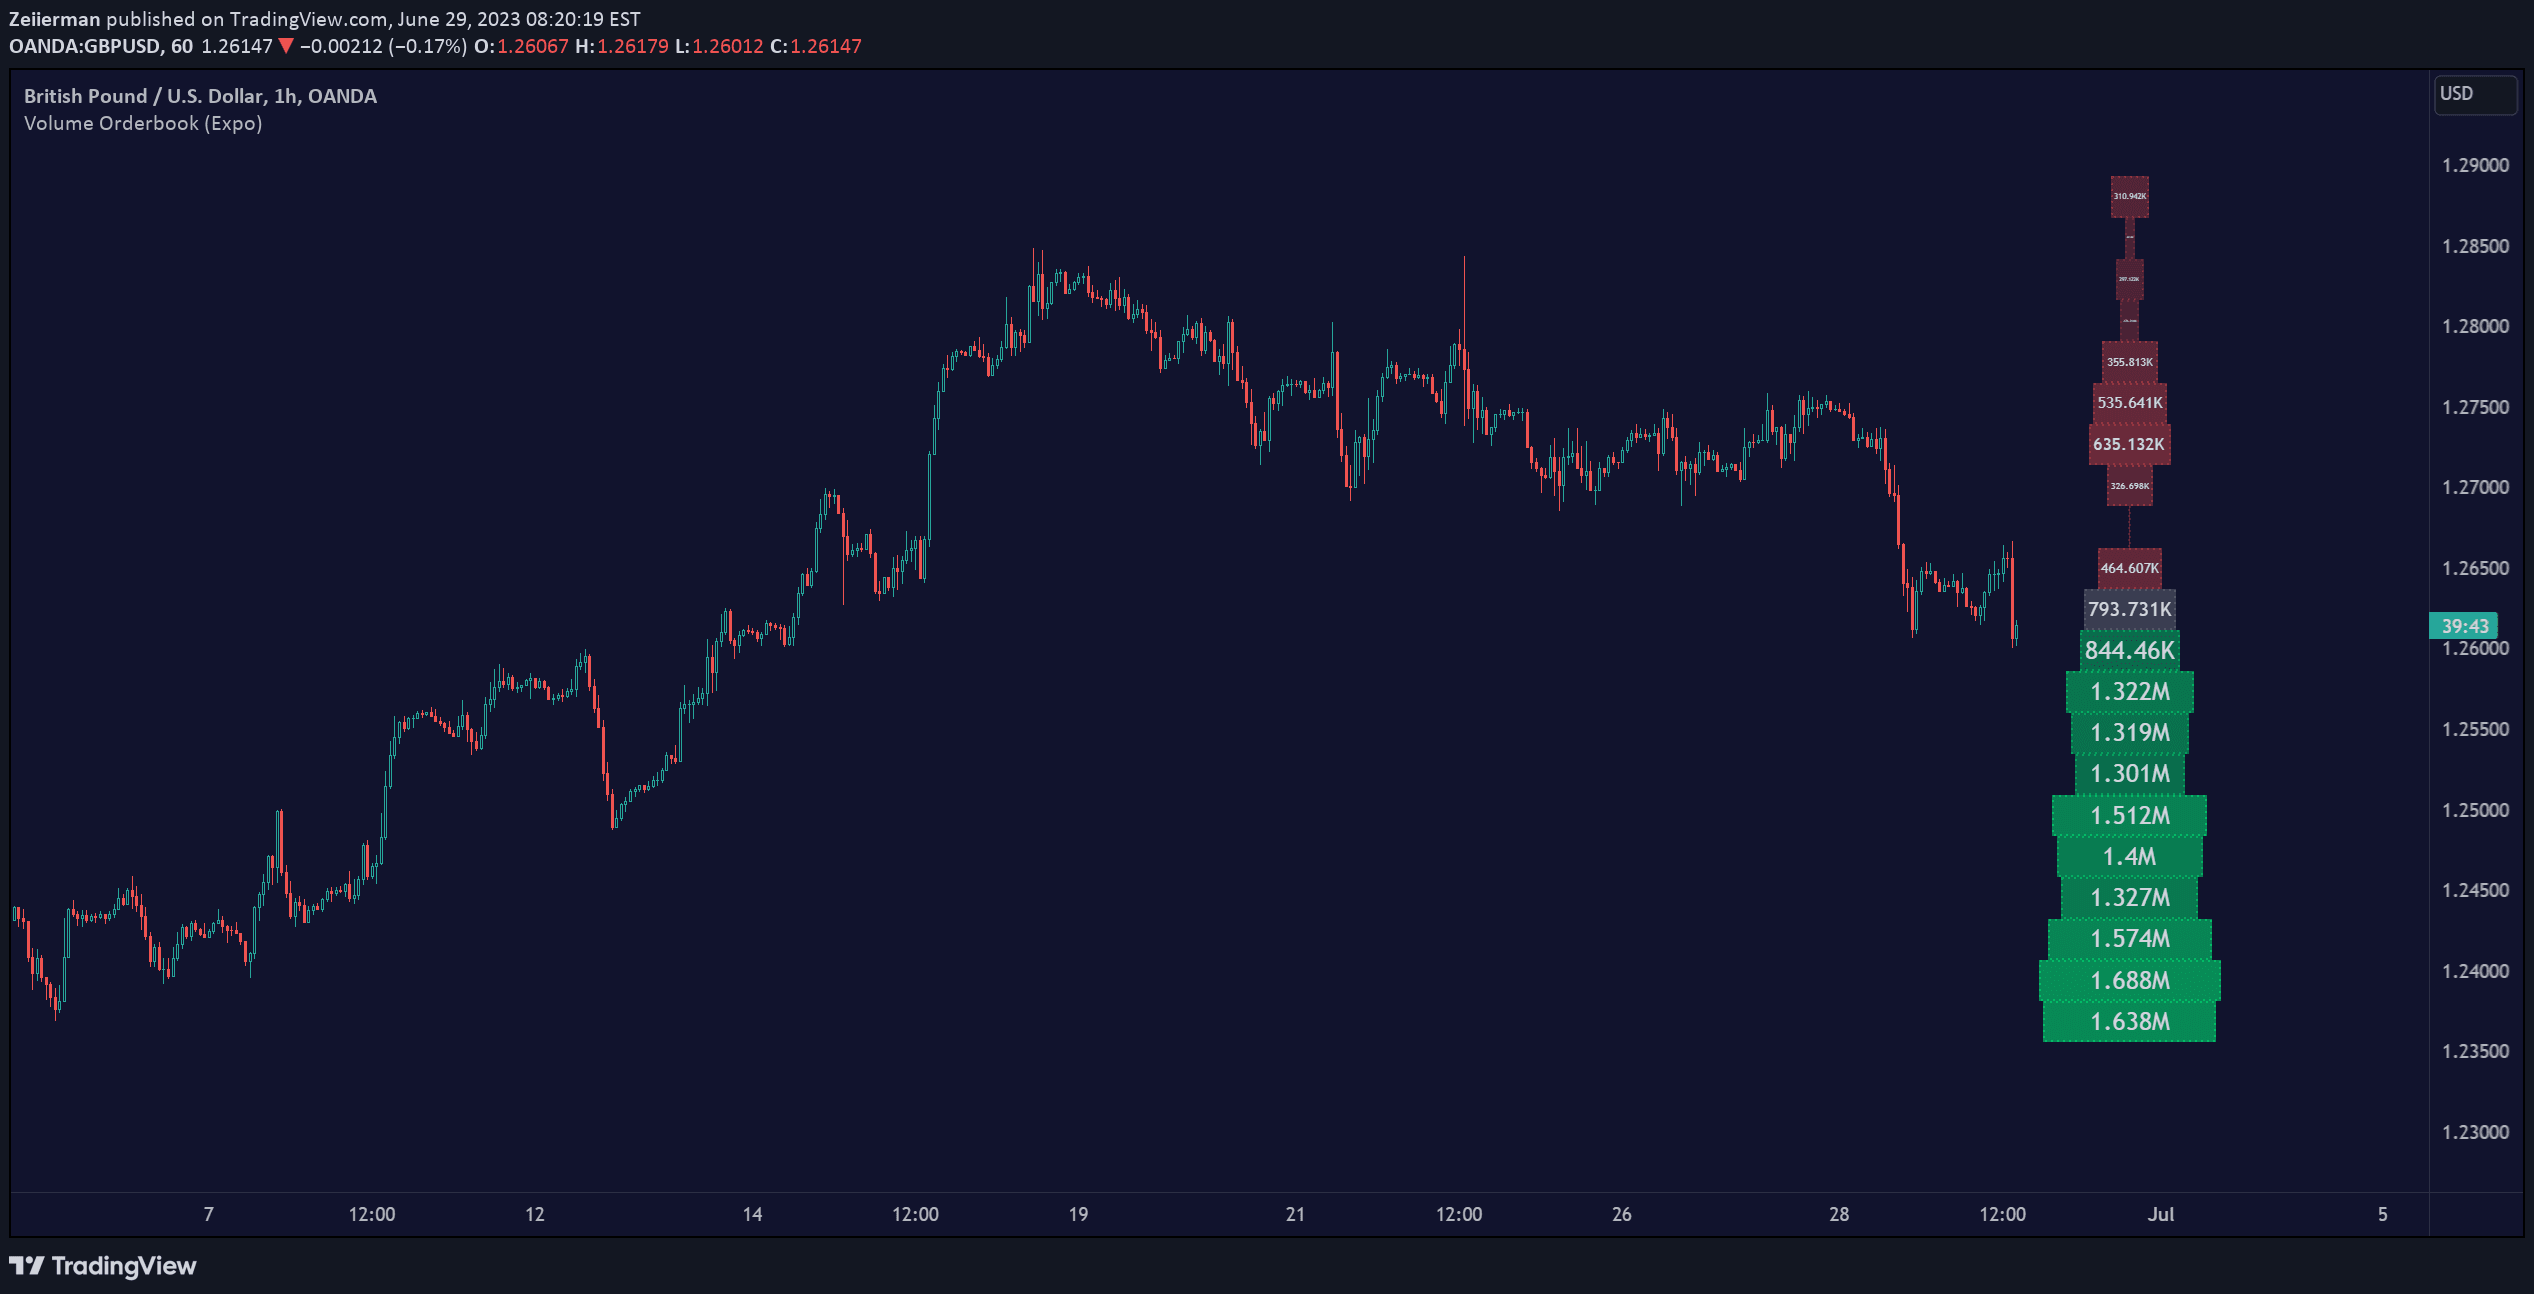
Volume Orderbook is a visual trading tool that displays trading volume across different price levels, helping traders identify significant market activity zones and potential support/resistance areas.
Explore complementary indicator rolesHow it works
The Volume Orderbook calculates cumulative trading volume within specific price zones across the chart's data range. It creates horizontal bars where the thickness represents the total trading volume, with each bar corresponding to a particular price level.
When prices move through different zones, the volume is added to the corresponding bar, creating a visual representation of historical trading activity. Thicker bars indicate more significant trading volume, helping traders understand where most market transactions have occurred.
Why it may be useful
The Volume Orderbook provides traders with critical insights into market psychology by revealing where significant trading activity has historically occurred. It helps identify potential support and resistance levels based on past trading volumes, offering a unique perspective on market dynamics.
By highlighting high-volume and low-volume zones, traders can better understand potential price movement barriers and areas of strong market interest. This visualization can help traders make more informed decisions about entry, exit, and trend confirmation strategies.
When to explore it
The Volume Orderbook is most effective in markets with clear, consistent trading patterns and sufficient historical volume data. It works best when analyzing longer-term price charts that provide a comprehensive view of trading activity across multiple timeframes.
Traders should use this indicator in conjunction with other technical analysis tools to validate signals and confirm potential trade setups. It is particularly useful when investigating market turning points, breakouts, and areas of significant price congestion.
Keep exploring
What we’ve verified
Access, alerts and repainting behaviour have not been independently verified for this indicator. Check the creator’s current publication and settings.
General descriptions and classifications are recovered research. Verified details above identify the specific checks we have completed. Check the creator’s current publication for later changes.


