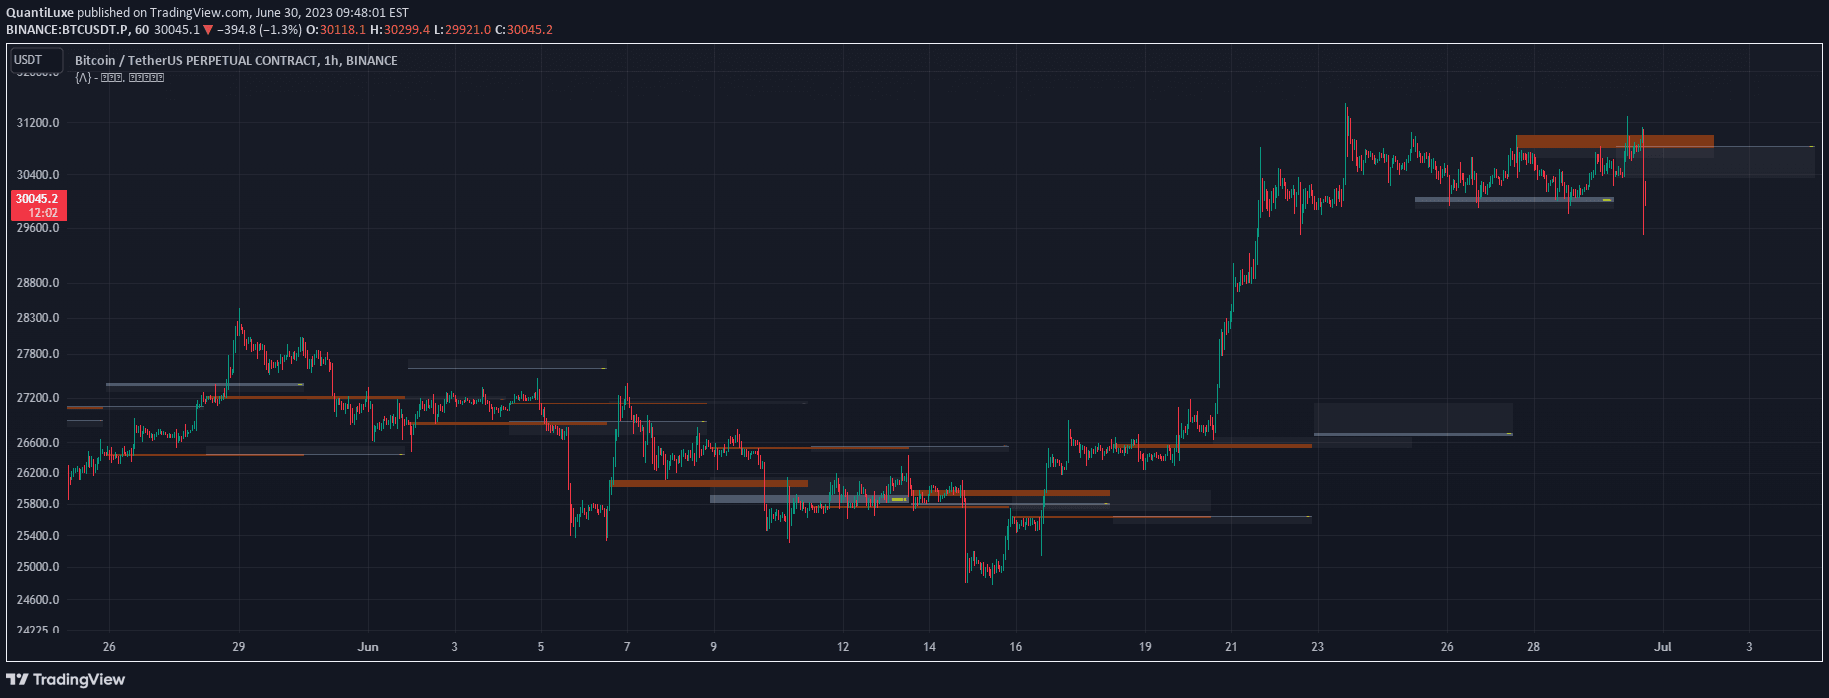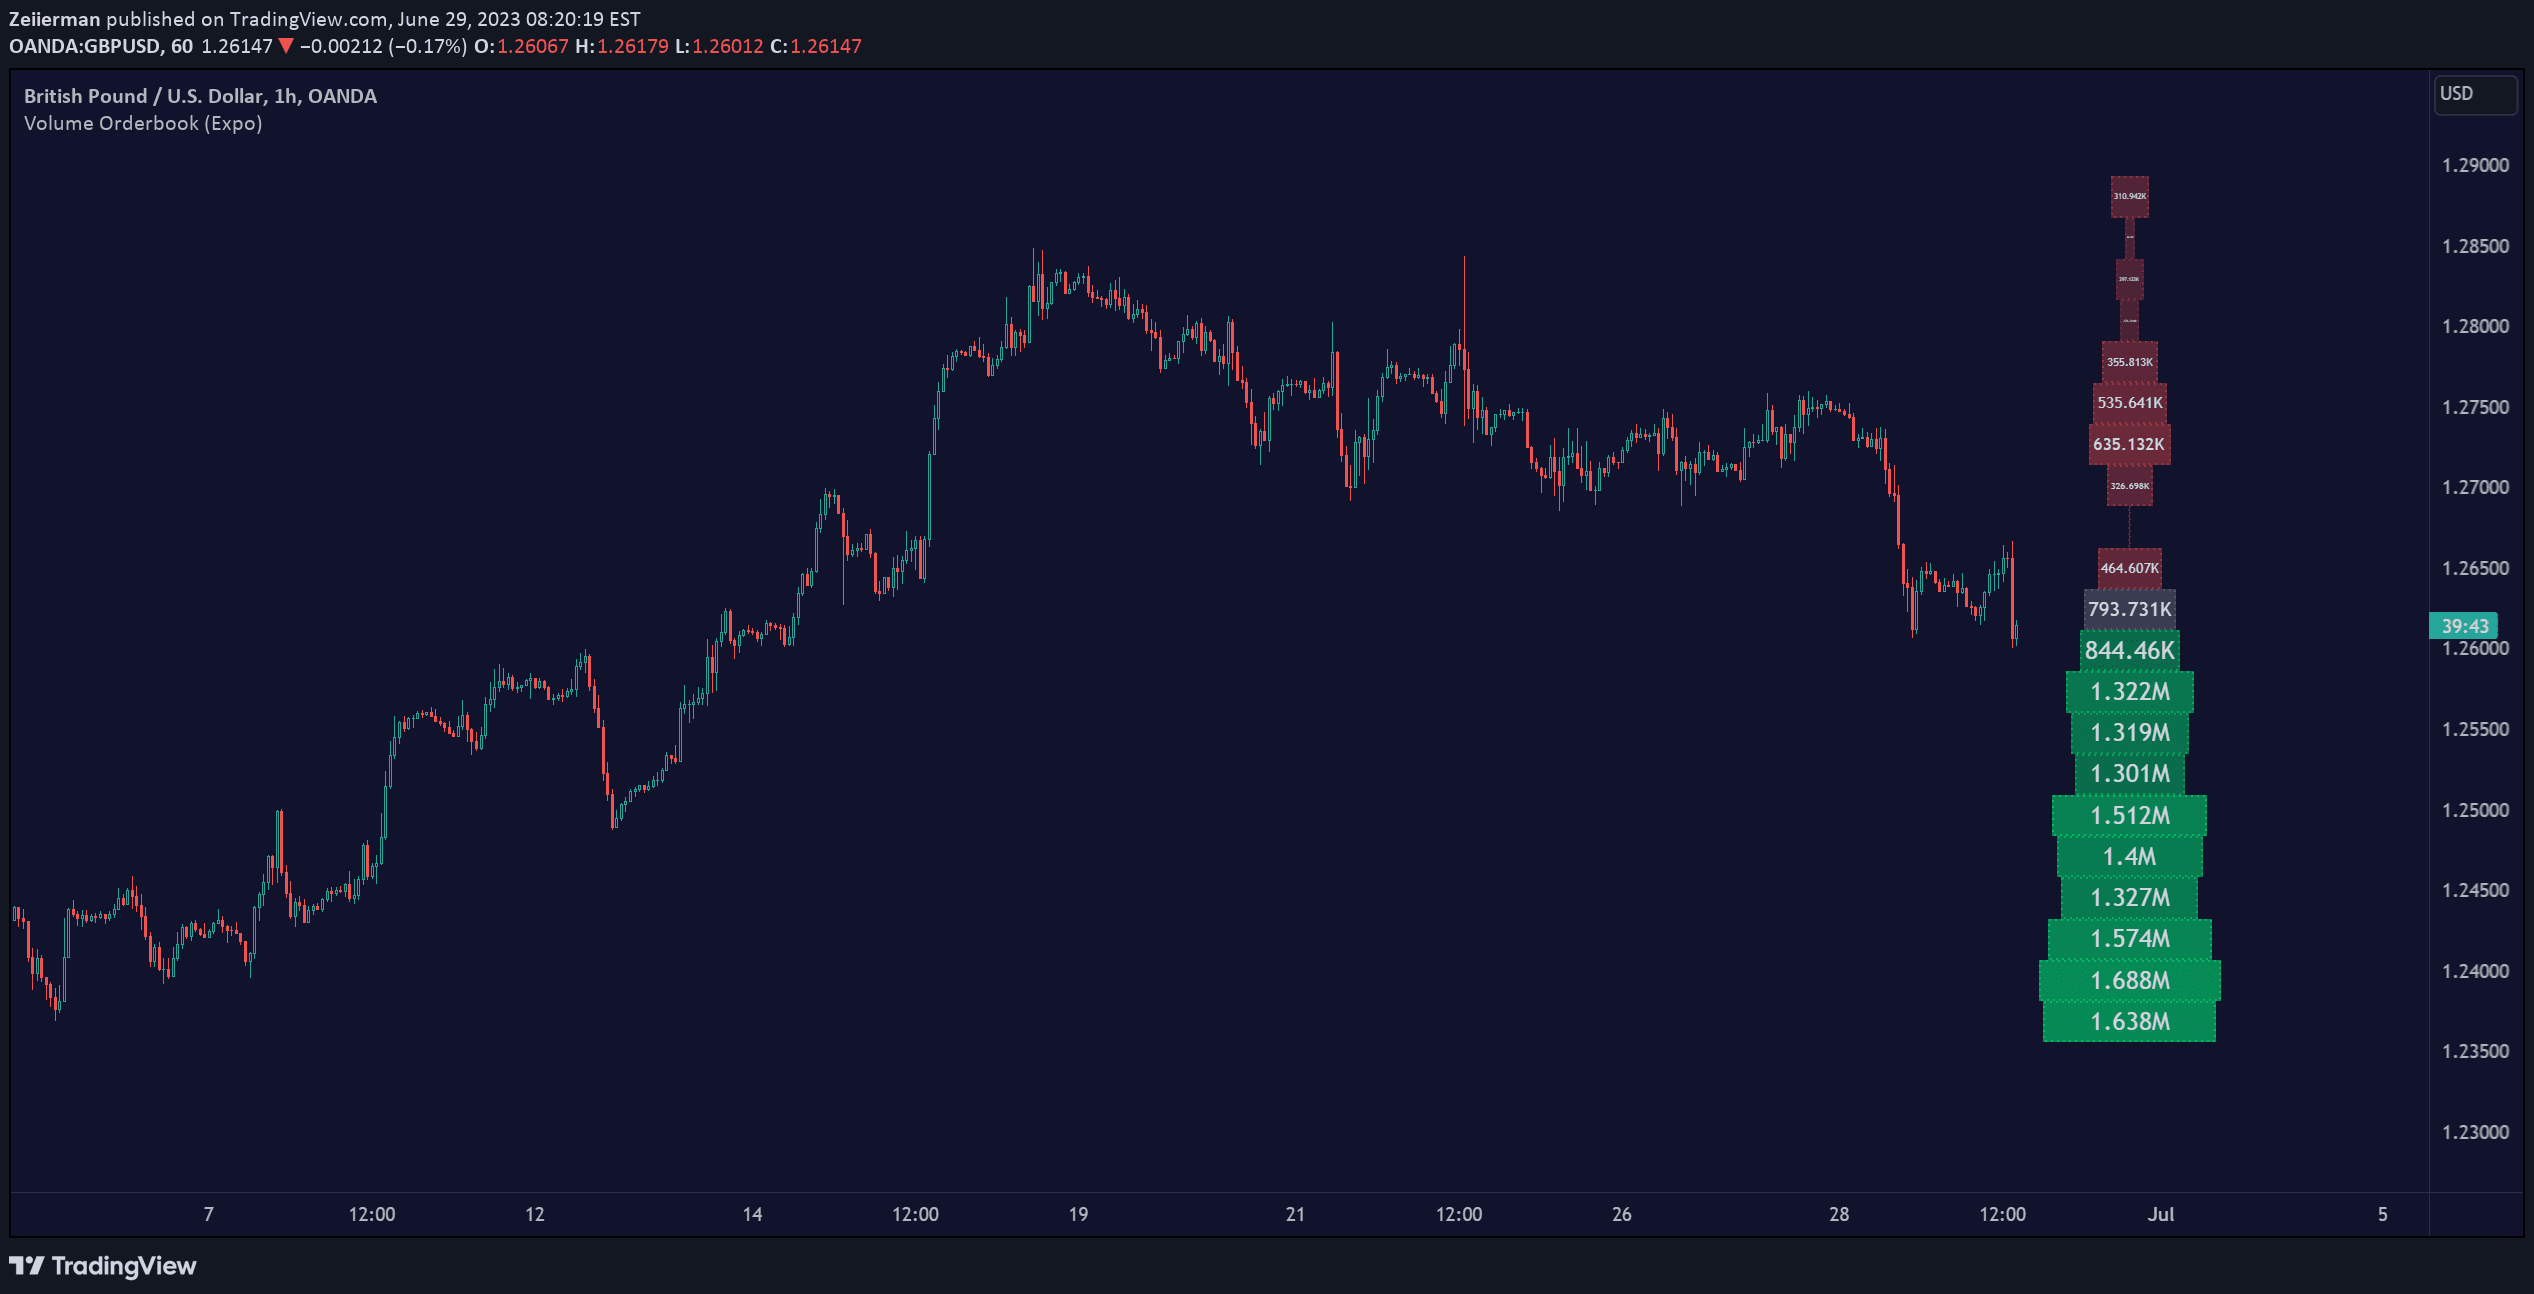
Volume Orderbook (Expo)
Volume Orderbook is a visual trading tool that displays trading volume across different price levels, helping traders identify significant market activity zones and potential support/resistance areas.
Explore 11,183 indicators. Filter beyond the obvious.
Discover the tools that fit the way you trade.
11,183 tools to explore
Volume Orderbook is a visual trading tool that displays trading volume across different price levels, helping traders identify significant market activity zones and potential support/resistance areas.
A trading indicator that identifies high-liquidity zones by analyzing volume concentrations at key market price levels, helping traders map potential support and resistance areas.
Volume Delta Methods analyze buying and selling pressure by comparing volume traded at different price levels, providing insights into market sentiment and trade dynamics.
An indicator that identifies price absorption points by tracking volume accumulation at specific levels, revealing potential market sentiment shifts and liquidity zones.
A volume-based indicator that identifies the most significant trading levels by revealing where the highest trading volume occurred during a specific lookback period.
A volume forecasting indicator that captures periodic volume fluctuations and predicts future trading volume by analyzing historical patterns and intervals.
A volume-based indicator that identifies key supply and demand zones by analyzing volume profile and highlighting significant market interest areas across different price levels.
A volume-based indicator that breaks down higher timeframe candles into 10 segments, revealing volume distribution and market sentiment across different timeframes.
A specialized indicator that detects high-volume trading bars by comparing current volume against a moving average and customizable volume multiplier settings.
The OBV Heikin Ashi indicator combines On-Balance Volume with Heikin Ashi transformation to provide a smoother representation of volume dynamics and price trends.
Advanced trading tool identifying order blocks, volume heatmaps, and institutional accumulation clusters to enhance market analysis and trading decision-making.
A volume distribution heatmap that visualizes trading volume concentration across different price levels, helping traders identify key market activity zones.
Likes, views, and comments are historical TradingView snapshots. They describe attention, not trading performance.