
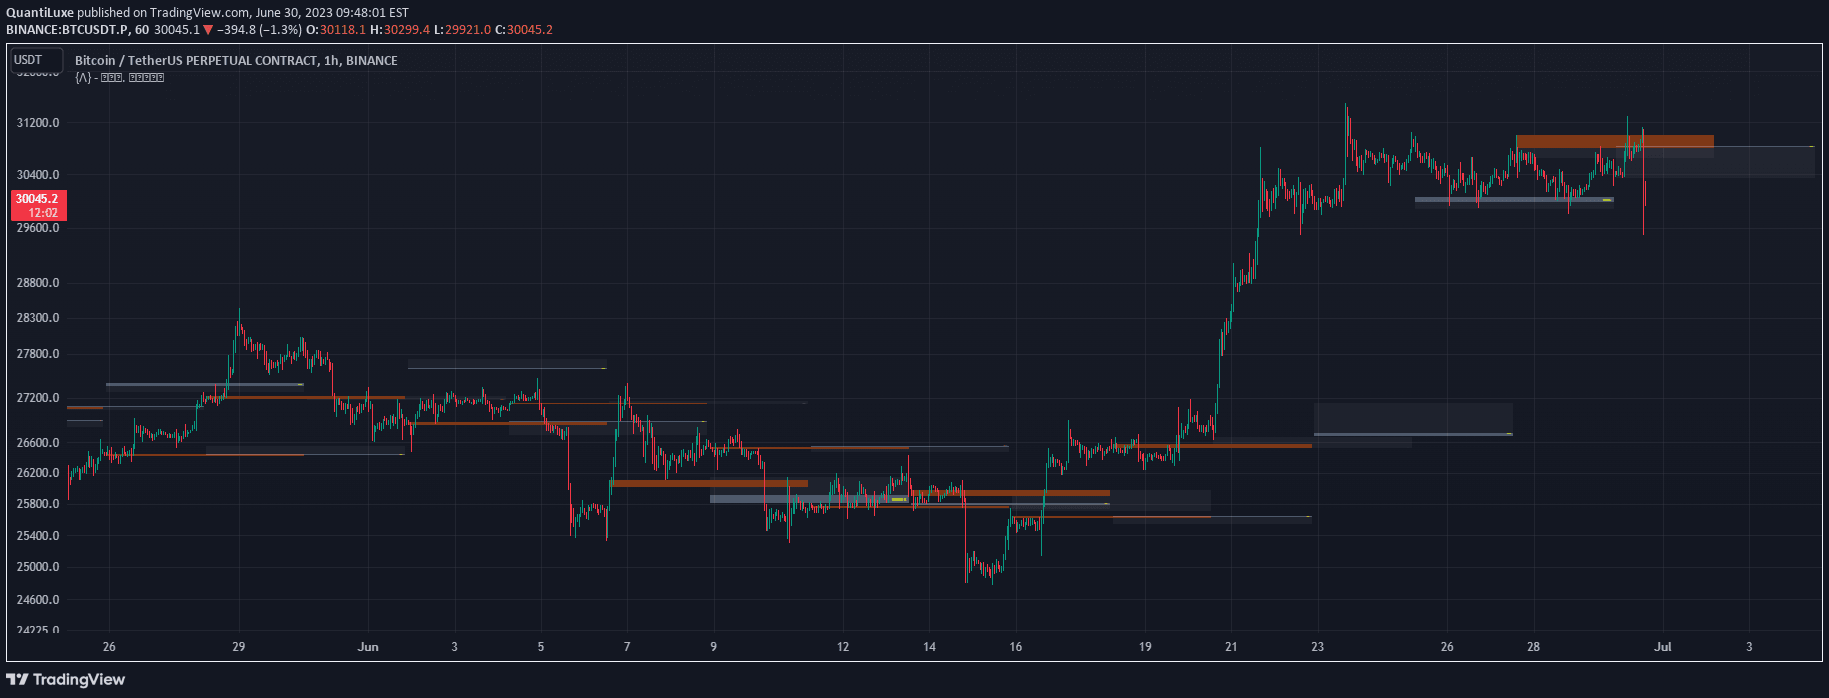
A volume-based indicator that identifies key supply and demand zones by analyzing volume profile and highlighting significant market interest areas across different price levels.
Explore complementary indicator rolesHow it works
The Liquidity Peaks indicator analyzes volume data within a specified lookback range to identify critical market zones. It maps out three distinct areas: liquidity grab, volume containment, and the most volumetric point by examining the volume profile across different price levels.
By utilizing volume data, the indicator creates visual representations of market interest through colored boxes. These boxes highlight potential supply and demand zones, revealing where significant buying or selling pressure has been concentrated during the analyzed period.
Why it may be useful
The Liquidity Peaks indicator provides traders with a nuanced understanding of market dynamics by revealing hidden volume-based insights. It helps traders identify potential support and resistance levels that might not be immediately apparent through traditional price analysis methods.
By mapping volume concentrations, traders can gain deeper insights into market sentiment, potential trend reversals, and areas of significant market participation. This approach allows for more informed decision-making by revealing underlying market structure beyond simple price movement.
When to explore it
The Liquidity Peaks indicator is most effective in markets with significant volume and clear trading ranges. It works best when analyzing historical price action to identify potential future support and resistance zones, particularly in liquid markets like forex, stocks, and futures.
Traders should use this indicator in conjunction with other technical analysis tools to confirm signals and validate potential trade setups. It is particularly useful during periods of market consolidation or when seeking to understand the market's volume-based structure.
Keep exploring
What we’ve verified
Access, alerts and repainting behaviour have not been independently verified for this indicator. Check the creator’s current publication and settings.
General descriptions and classifications are recovered research. Verified details above identify the specific checks we have completed. Check the creator’s current publication for later changes.


