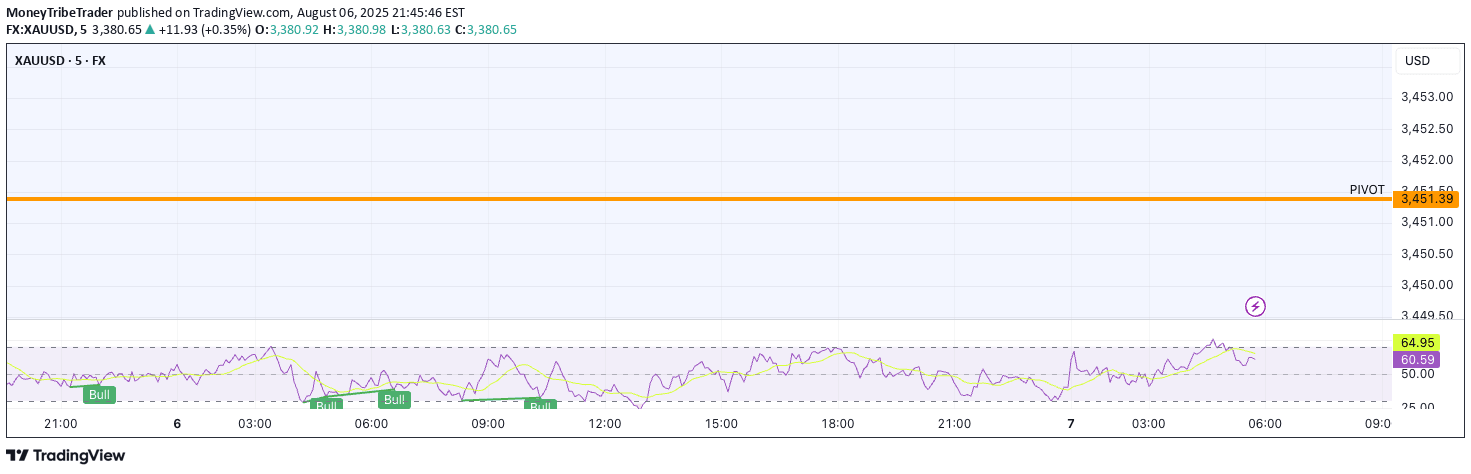
Liquidity Key Zones indicator displays previous high and low levels across multiple timeframes, helping traders identify potential market reversal and continuation zones.
Explore complementary indicator rolesHow it works
The Liquidity Key Zones indicator calculates and displays previous high and low levels for multiple timeframes including daily, weekly, monthly, quarterly, and yearly periods. It plots these critical price zones directly on the chart, allowing traders to visualize key support and resistance levels that can influence market behavior.
These zones act as potential attraction and repulsion points for price, creating opportunities for traders to identify potential reversals or continuations. By showing previous level averages and opening prices, the indicator provides a comprehensive view of historical price dynamics across different time horizons.
Why it may be useful
Liquidity Key Zones are crucial for traders because they reveal significant price levels where market participants have previously shown heightened activity and interest. These zones represent potential areas of support, resistance, and potential trend reversals, giving traders strategic insights into market psychology and potential price movements.
By understanding these key levels, traders can make more informed decisions about entry and exit points, manage risk more effectively, and develop more structured trading strategies that incorporate multiple timeframe analysis.
When to explore it
The Liquidity Key Zones indicator works best during periods of clear market trends and when price is approaching or breaking through significant historical levels. Traders should pay special attention to these zones during market openings, after significant news events, or when price is showing signs of potential reversal or continuation.
It is particularly effective when combined with other technical analysis tools, such as the X Model, which leverages multiple timeframes and technical indicators to refine trade entries and exits. The indicator is most valuable when used as part of a comprehensive trading strategy that considers multiple confirming signals.
Keep exploring
What we’ve verified
Access, alerts and repainting behaviour have not been independently verified for this indicator. Check the creator’s current publication and settings.
General descriptions and classifications are recovered research. Verified details above identify the specific checks we have completed. Check the creator’s current publication for later changes.