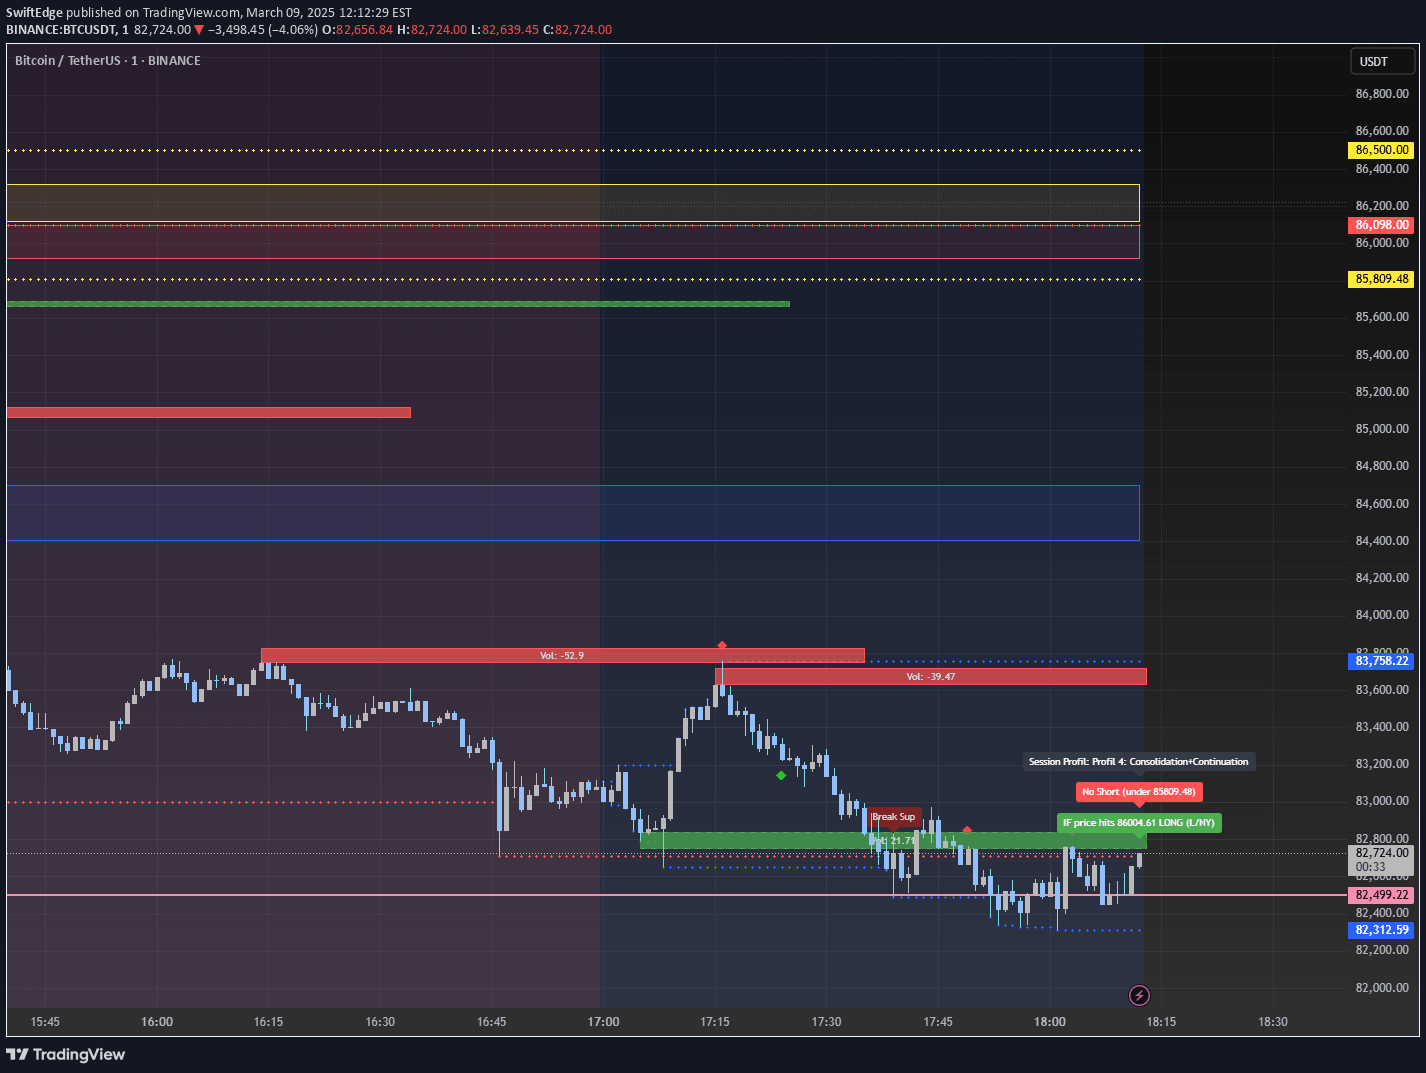
A liquidity indicator that highlights swing areas with trading activity, tracking price revisits, accumulated volume, and potential support/resistance zones using customizable filtering.
Explore complementary indicator rolesHow it works
The liquidity swings indicator analyzes price movements and trading activity within specific swing areas on a chart. It calculates pivot points using a user-defined lookback period and identifies swing highs and lows based on price action. The indicator tracks how many times price revisits these swing areas and measures the accumulated volume within them.
Users can customize the calculation method, choosing between 'Wick Extremity' or 'Full Range' for defining swing areas. The indicator also offers intrabar precision for more accurate volume calculations and provides filtering options to focus on significant swing areas based on visit count or volume threshold.
Why it may be useful
This indicator helps traders identify significant liquidity zones that might represent potential support or resistance levels in future price movements. By highlighting areas with substantial trading activity, it provides insights into market dynamics and potential price reversal points. The visual representation of swing areas allows traders to understand market structure and liquidity concentration.
The ability to filter swing areas by volume or visit count enables traders to focus on the most meaningful zones, reducing noise and improving decision-making. By revealing where price has previously shown interest, traders can develop more informed strategies and understand the market's underlying liquidity patterns.
When to explore it
The liquidity swings indicator is most effective when used in conjunction with other technical analysis tools, particularly on lower timeframes where liquidity dynamics are more pronounced. It works best in markets with clear price structures and consistent trading activity, such as major forex pairs, stock indices, and liquid commodities.
Traders can use this indicator to identify potential entry and exit points based on historical price behavior. The indicator is particularly useful during range-bound or consolidating markets where identifying key liquidity zones can provide strategic insights. Traders should combine this tool with trend analysis, momentum indicators, and volume studies to validate potential trading opportunities and improve overall market understanding.
Keep exploring
What we’ve verified
Access, alerts and repainting behaviour have not been independently verified for this indicator. Check the creator’s current publication and settings.
General descriptions and classifications are recovered research. Verified details above identify the specific checks we have completed. Check the creator’s current publication for later changes.