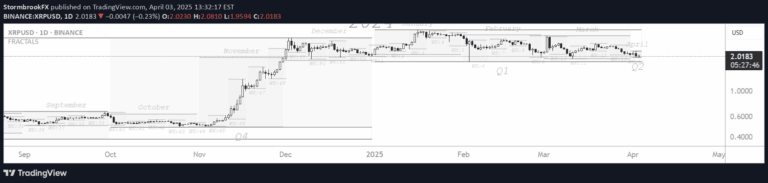
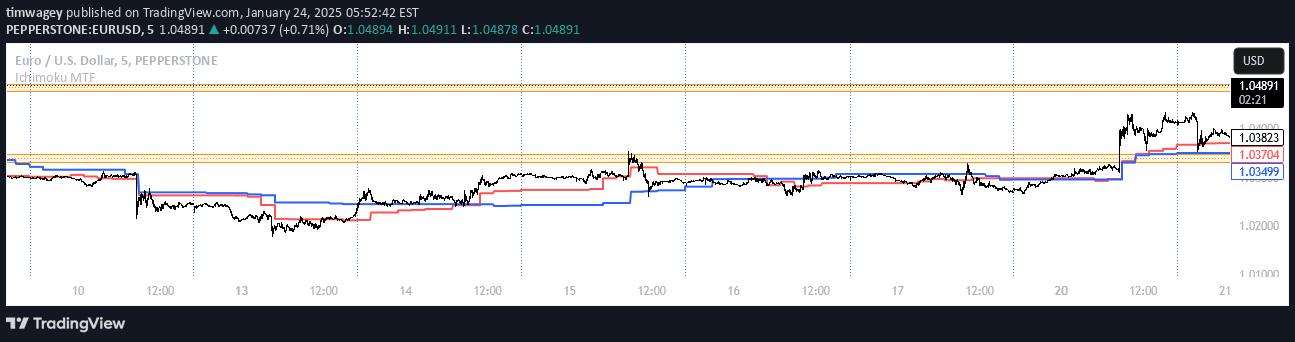
A multi-timeframe indicator that identifies fractal price patterns, highlighting support/resistance levels and potential liquidity zones across different chart timeframes.
Explore complementary indicator rolesHow it works
MTF Fractals works by analyzing price action patterns across multiple timeframes to identify key market turning points. The indicator examines five consecutive candles and determines fractal formations based on selected bar settings (3, 5, 7, or 9 bars), with higher bar counts producing more reliable signals.
The system then projects these fractal levels horizontally across the chart, creating visual reference lines that highlight potential liquidity zones. When a candle closes beyond a fractal line with a penetrating wick, the indicator marks this as a liquidity sweep, signaling a potential reversal or continuation opportunity.
Why it may be useful
Fractals provide traders with critical insights into market structure by identifying key support and resistance levels that might otherwise go unnoticed. By visualizing these levels across multiple timeframes, traders gain a more comprehensive understanding of potential price interaction zones and liquidity dynamics.
The multi-timeframe approach allows traders to connect different market perspectives, revealing hidden trading opportunities and providing context that single-timeframe analysis might miss. This comprehensive view helps traders make more informed decisions by understanding broader market context and potential price reaction points.
When to explore it
MTF Fractals is most effective during trending and range-bound market conditions where clear support and resistance levels are crucial for trading decisions. Traders can utilize this indicator when seeking to identify potential reversal zones, liquidity sweep opportunities, and critical price interaction points across different timeframes.
The indicator works particularly well in markets with defined price structures, such as forex, futures, and liquid stock markets. It is especially valuable for traders who want to enhance their technical analysis by incorporating multi-timeframe perspectives and understanding complex market dynamics.
Keep exploring
What we’ve verified
Access, alerts and repainting behaviour have not been independently verified for this indicator. Check the creator’s current publication and settings.
General descriptions and classifications are recovered research. Verified details above identify the specific checks we have completed. Check the creator’s current publication for later changes.