
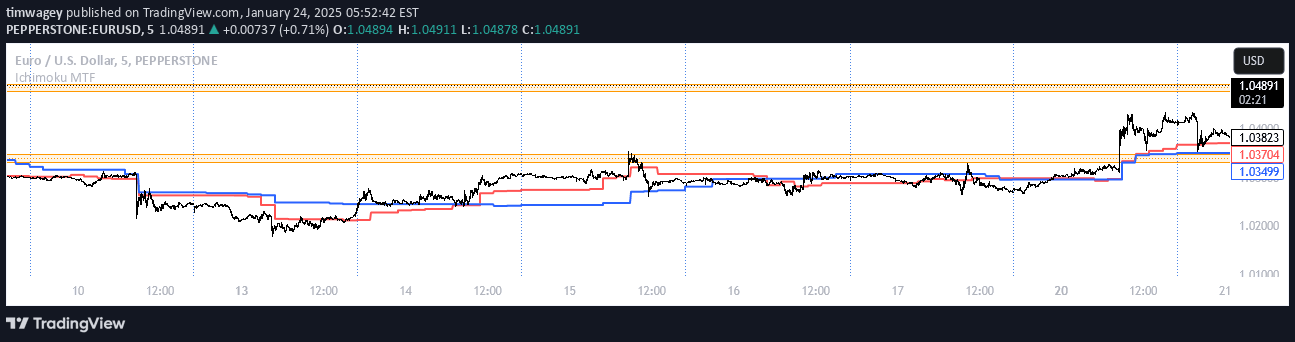
Ichimoku Cloud is a multi-component technical indicator that visually displays trend direction, support/resistance levels, and potential future price movements using multiple averages.
Explore complementary indicator rolesHow it works
The Ichimoku Cloud uses five distinct lines to analyze market trends and potential future price movements. These lines include the Conversion Line, Base Line, Leading Span A, Leading Span B, and a lagging line, which are calculated using different time periods and moving averages.
The cloud is formed by the space between Leading Span A and Leading Span B, which projects potential support and resistance areas into the future. When the price is above the cloud, it indicates an uptrend, while being below the cloud suggests a downtrend, with movement within the cloud representing a transitional or neutral market condition.
Why it may be useful
The Ichimoku Cloud provides traders with a comprehensive view of market dynamics by simultaneously revealing trend direction, momentum, and potential future support and resistance levels. Its unique ability to project future price zones sets it apart from many traditional technical indicators, offering traders a more forward-looking analytical tool.
By integrating multiple components into a single visual representation, the Ichimoku Cloud helps traders quickly assess market conditions and make more informed trading decisions. Its versatility allows for use across different financial markets and timeframes, making it a valuable tool for traders seeking a holistic approach to technical analysis.
When to explore it
The Ichimoku Cloud is most effective in markets with clear trending conditions, particularly in stocks, forex, and cryptocurrency trading. It works best when combined with other technical indicators like the Relative Strength Index (RSI) to confirm momentum and validate trading signals.
Traders should be cautious and consider broader market context when using the Ichimoku Cloud, as temporary price movements can occur against the overall trend. It is particularly useful for identifying potential entry and exit points during trend confirmations, crossovers, and when the price interacts with the cloud's support and resistance zones.
Keep exploring
What we’ve verified
Access, alerts and repainting behaviour have not been independently verified for this indicator. Check the creator’s current publication and settings.
General descriptions and classifications are recovered research. Verified details above identify the specific checks we have completed. Check the creator’s current publication for later changes.


