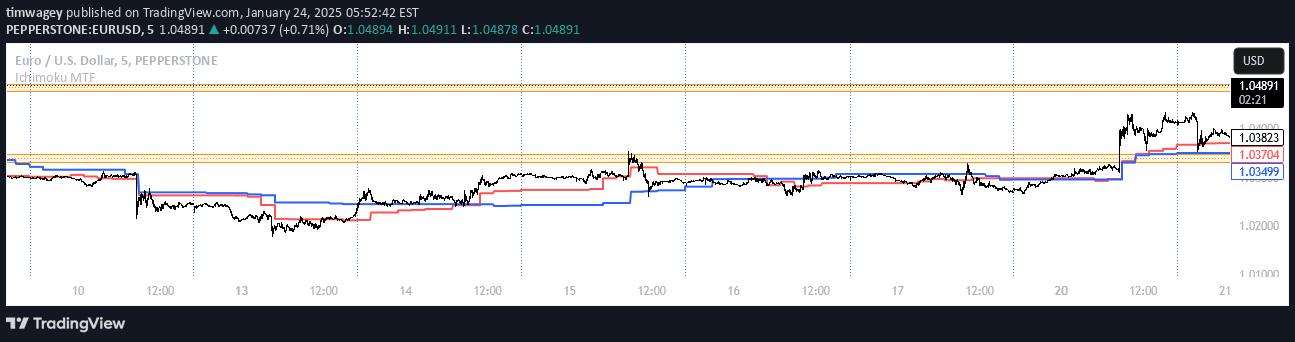
An advanced trading indicator combining Ichimoku Cloud trend analysis with machine learning support and resistance levels to help traders identify market dynamics and potential price zones.
Explore complementary indicator rolesHow it works
The Ichimoku Cloud component identifies market trend direction and momentum through multiple lines and a cloud formation, showing support and resistance areas. The Tenkan-sen and Kijun-sen lines help signal potential trend changes, while the cloud itself indicates broader market equilibrium.
Simultaneously, the Machine Learning module analyzes historical price data to project significant support and resistance levels as horizontal lines. By dynamically computing these levels based on each specific asset's historical patterns, the algorithm creates precise price zones where traders can anticipate potential market reactions.
Why it may be useful
This indicator provides traders with a multi-layered approach to market analysis by combining traditional technical analysis with advanced machine learning techniques. The Ichimoku Cloud offers visual trend mapping, while the ML levels add forward-looking context specific to each asset, helping traders filter out false signals and highlight high-probability trading zones.
By integrating these two powerful analytical methods, traders gain a more comprehensive view of market behavior. The indicator helps identify not just current trend direction, but also potential future price interactions, enabling more informed and strategic trading decisions across various market conditions.
When to explore it
This indicator works best in markets with clear trending characteristics, particularly for assets that show consistent historical price patterns. It is most effective when used on liquid markets with sufficient historical data for machine learning analysis, such as major stocks, cryptocurrencies, and actively traded instruments.
Traders should utilize this tool when seeking to confirm trend direction, identify potential entry and exit points, and understand the broader market context. It is particularly useful during trending market phases, where the Ichimoku Cloud and ML levels can provide complementary insights into potential price movements and support/resistance zones.
Keep exploring
What we’ve verified
Access, alerts and repainting behaviour have not been independently verified for this indicator. Check the creator’s current publication and settings.
General descriptions and classifications are recovered research. Verified details above identify the specific checks we have completed. Check the creator’s current publication for later changes.