
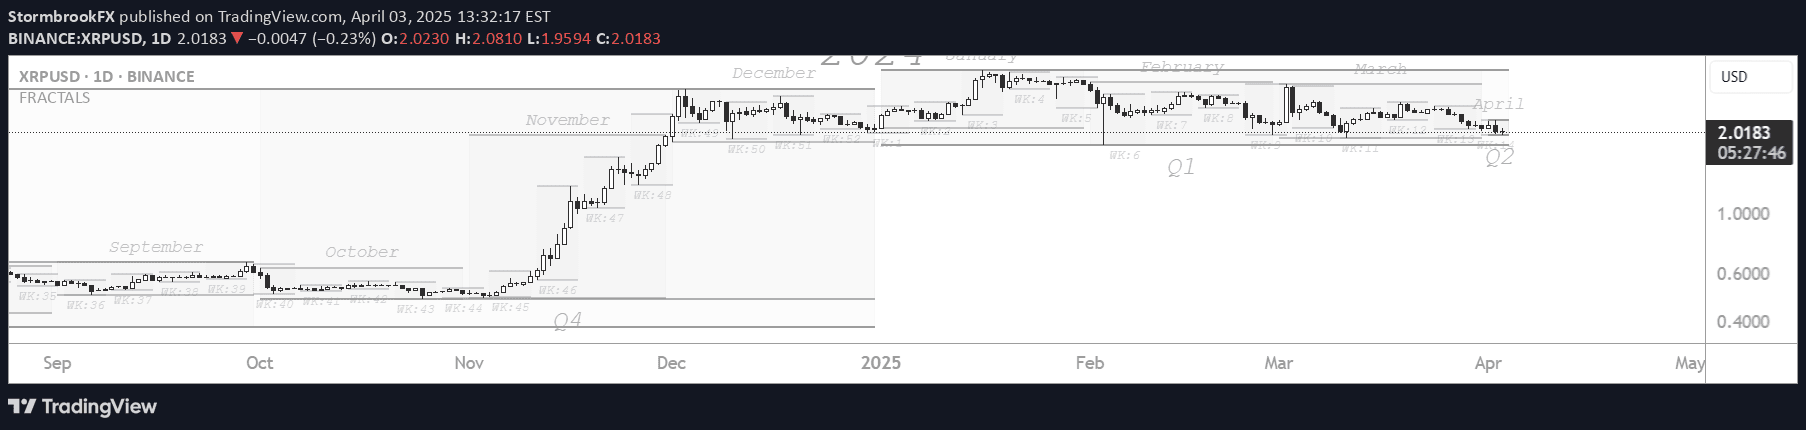
Fractal Dimensions is a multi-timeframe analysis tool that visualizes market dynamics across different wave degrees, providing deeper insights into market structure and potential trading opportunities.
Explore complementary indicator rolesHow it works
Fractal Dimensions operates by mapping market movements across multiple time frames, creating a multidimensional view of price action. It breaks down market dynamics into different wave degrees, ranging from primary to sub-minute timeframes, allowing traders to understand underlying market structure beyond single-timeframe analysis.
By analyzing these dimensional data points, the indicator helps traders identify potential trend trajectories and market movements with greater precision. The method enables visualization of market behavior across various scales, providing a more comprehensive understanding of price action and potential trading opportunities.
Why it may be useful
Fractal Dimensions offers traders a sophisticated approach to understanding market complexity by revealing hidden patterns and relationships across different time frames. This multi-dimensional perspective allows for more nuanced market analysis, helping traders make more informed decisions by seeing beyond traditional single-timeframe interpretations.
The indicator's unique approach provides deeper insights into market structure, enabling traders to identify potential trend dynamics and market movements with enhanced clarity. By breaking down market behavior into different wave degrees, traders can develop a more comprehensive view of price action and potential trading strategies.
When to explore it
Fractal Dimensions is most effective when traders want to gain a comprehensive view of market dynamics across multiple time frames. It works particularly well in markets with complex, non-linear price movements, where traditional single-timeframe analysis might miss crucial structural insights.
The indicator is especially valuable during periods of market transition or when seeking to understand underlying trend dynamics. Traders can utilize this tool to identify potential entry and exit points by analyzing market structure from a multi-dimensional perspective, making it particularly useful in volatile or trending market conditions.
Keep exploring
What we’ve verified
Access, alerts and repainting behaviour have not been independently verified for this indicator. Check the creator’s current publication and settings.
General descriptions and classifications are recovered research. Verified details above identify the specific checks we have completed. Check the creator’s current publication for later changes.


