Volume-based Support & Resistance Zones
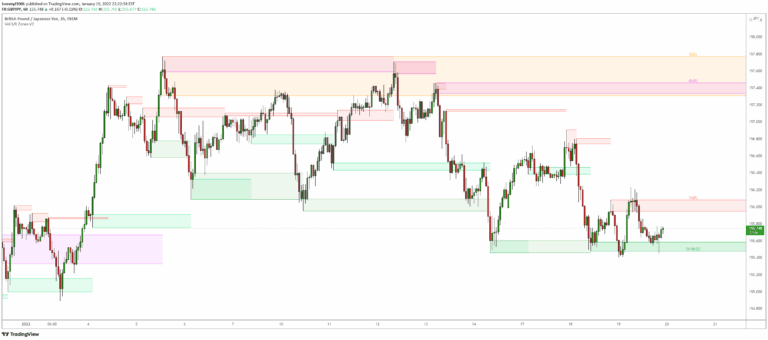
An advanced Support & Resistance indicator that identifies significant price zones using volume and fractal highs/lows, helping traders visualize potential trend reversals and continuations.
Explore 11,183 indicators. Filter beyond the obvious.
Discover the tools that fit the way you trade.
11,183 tools to explore
An advanced Support & Resistance indicator that identifies significant price zones using volume and fractal highs/lows, helping traders visualize potential trend reversals and continuations.
A market structure indicator using fractal patterns to detect trend changes, support/resistance levels, and market reversals with adaptive analysis of price movements.
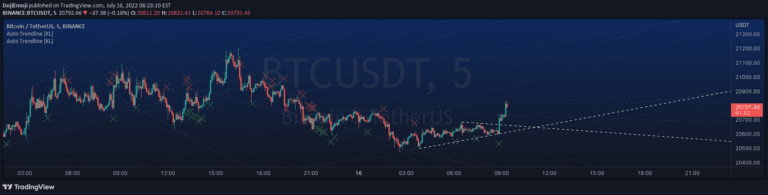
An automated tool that systematically draws trend lines by connecting recent fractals, helping traders identify potential price action patterns without subjective manual drawing.
Renko Candles Overlay is a charting technique that transforms price action into uniform-sized bricks, offering a simplified visual representation of market trends and price movements.
A price action indicator that detects liquidity sweeps by identifying key swing points and tracking price movements through critical liquidity levels without complex numerical settings.
FRAMA Channel is a dynamic trend-following indicator that adapts to market conditions, creating an adaptive channel around price to identify trend changes and market momentum.
A trading tool that uses Interbank Price Delivery Algorithm to identify time windows and standard deviations across multiple timeframes for potential price movement prediction.
A customizable Williams Fractal indicator that plots high and low fractals with a dynamic stop line, allowing traders to configure fractal confirmation and trailing stops.
A dynamic trailing stop indicator using Fair Value Gaps (FVG) to identify trend direction and potential trend reversals by tracking unmitigated price gaps.
A precise indicator that identifies double top and bottom reversal patterns in market price action, helping traders recognize potential trend changes with customizable settings and visual enhancements.
Advanced machine learning trading strategy utilizing signal processing techniques and custom moving averages to generate precise housing market trading signals and performance metrics.
Market structure analysis helps traders identify trend direction, break of structure (BOS), and change of character (CHOCH) to understand market movements and potential trend reversals.
Likes, views, and comments are historical TradingView snapshots. They describe attention, not trading performance.