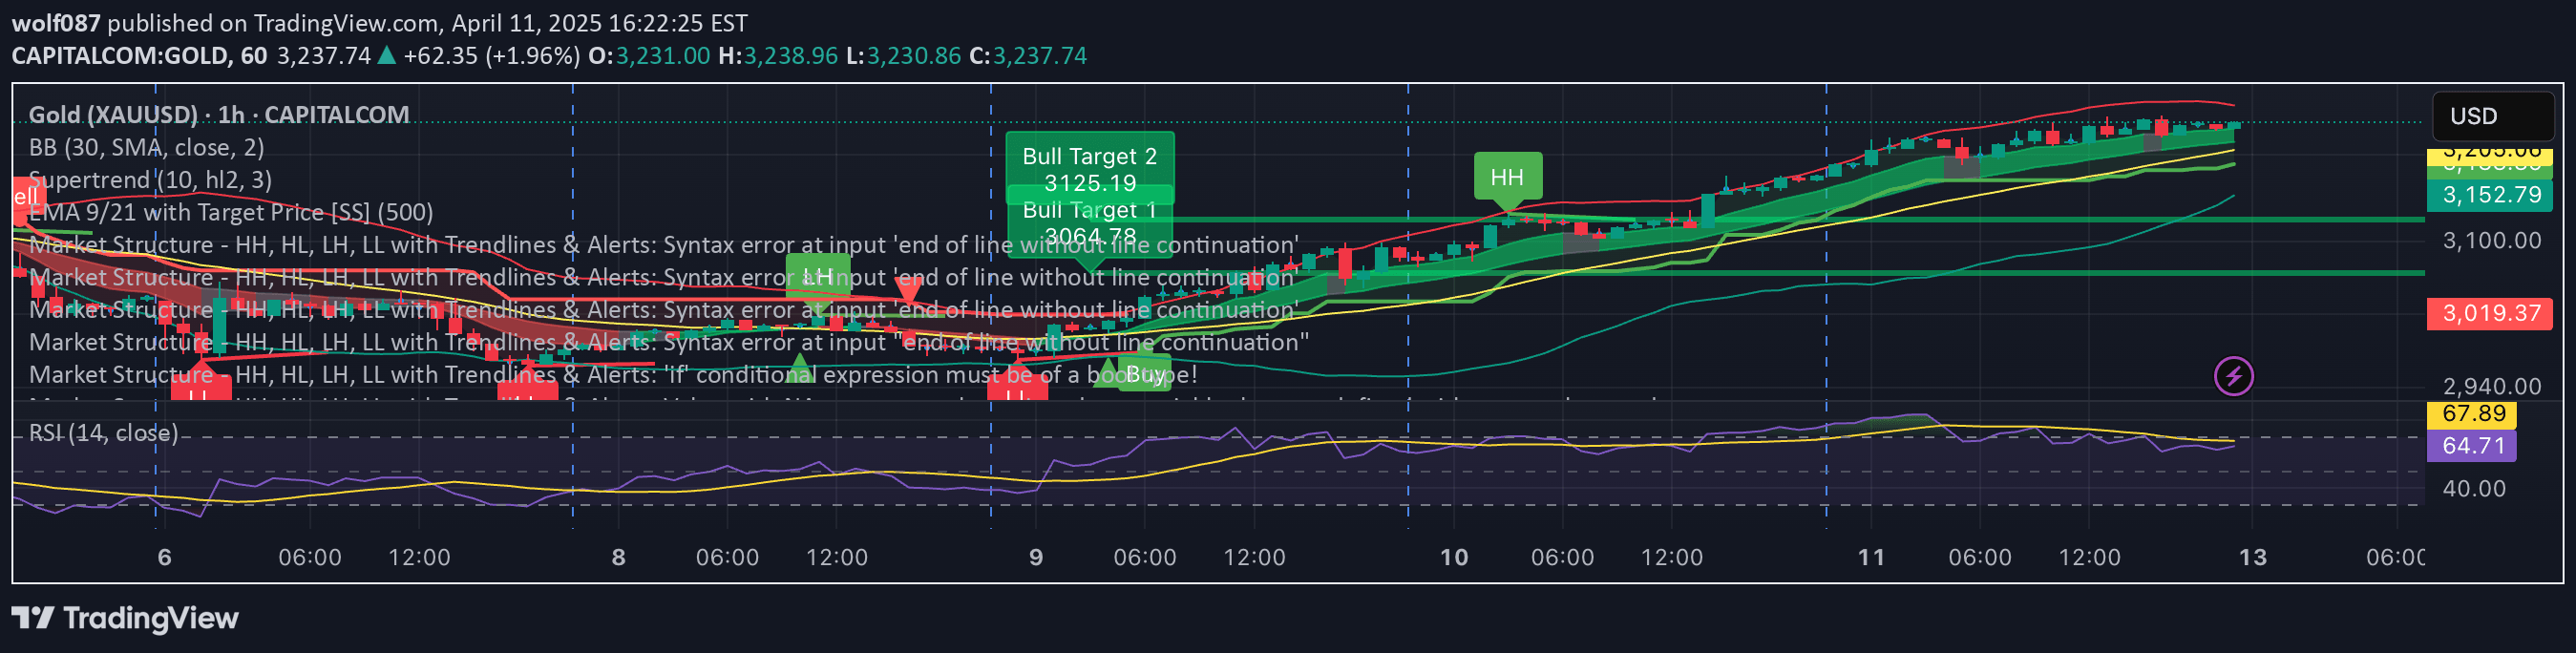
An automated tool that systematically draws trend lines by connecting recent fractals, helping traders identify potential price action patterns without subjective manual drawing.
Explore complementary indicator rolesHow it works
The fractal-based trend line tool automatically identifies pivot points in price action by examining a specified number of surrounding bars. It determines valid high and low points based on a configurable fractal period, typically set around 5 bars.
The tool connects these fractal points to create trend lines across the chart. By using an objective method, it removes human bias in line drawing. The lines can be extended historically or prospectively, providing a systematic approach to visualizing potential price support and resistance levels
Why it may be useful
Trend lines are crucial for understanding market psychology and potential price movements. This automated tool eliminates subjective line drawing, reducing trader bias and emotional decision-making. By systematically connecting fractals, traders can objectively identify potential support and resistance levels.
The tool helps visualize market structure and potential turning points without relying on individual interpretation. It provides a more consistent and repeatable method of trend line analysis, potentially improving trading strategy development and decision-making processes
When to explore it
This trend line tool works best in markets with clear price action and identifiable pivot points. It is most effective in trading instruments with moderate volatility, such as major stock indices, forex pairs, and liquid commodities.
Traders should use it as a complementary tool alongside other technical analysis methods. It is particularly useful for day and swing traders looking to identify potential trend reversals or continuation patterns. The tool's effectiveness increases when combined with volume analysis and other trend confirmation indicators
Keep exploring
What we’ve verified
Access, alerts and repainting behaviour have not been independently verified for this indicator. Check the creator’s current publication and settings.
General descriptions and classifications are recovered research. Verified details above identify the specific checks we have completed. Check the creator’s current publication for later changes.