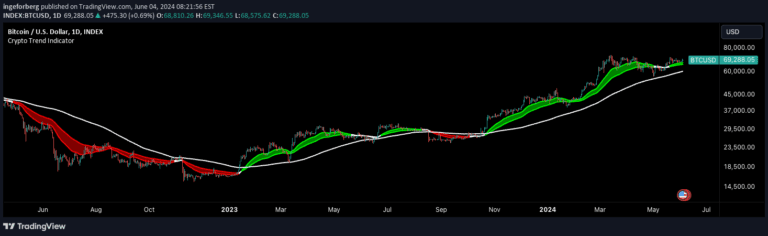
A technical indicator that measures trend strength by comparing average bullish and bearish candle ranges, generating buy and sell signals when these lines cross.
Explore complementary indicator rolesHow it works
The Prevailing Trend indicator calculates two key lines: a blue line representing the average range of bullish candles and a red line representing the average range of bearish candles. These lines dynamically track the market's price action, providing visual insight into the current trend momentum.
When the blue line crosses above the red line, it suggests increasing bullish strength, while a red line crossing above the blue line indicates growing bearish momentum. Traders can use these crossovers as potential entry signals, with the lines' relative positions helping to confirm the current market trend direction.
Why it may be useful
The Prevailing Trend indicator helps traders identify high-probability trend entries by quantifying the relative strength of bullish and bearish price movements. By comparing the average ranges of positive and negative candles, it provides a more nuanced view of market momentum than traditional trend indicators.
This approach allows traders to make more informed decisions by understanding not just the direction of the trend, but the underlying strength driving price action. The indicator can be used both as a primary entry signal and as a filter to ensure trades align with the prevailing market trend.
When to explore it
The Prevailing Trend indicator works best in markets with clear trending characteristics, such as forex, stocks, and futures with consistent directional movements. It is particularly effective during periods of sustained market momentum, where price continues to move in a defined direction with strong follow-through.
Traders should be cautious during periods of high market volatility or choppy sideways price action, as frequent line crossovers can generate false signals. Combining this indicator with other technical analysis tools like support and resistance levels or momentum oscillators can help confirm its signals and improve overall trading accuracy.
Keep exploring
What we’ve verified
Access, alerts and repainting behaviour have not been independently verified for this indicator. Check the creator’s current publication and settings.
General descriptions and classifications are recovered research. Verified details above identify the specific checks we have completed. Check the creator’s current publication for later changes.