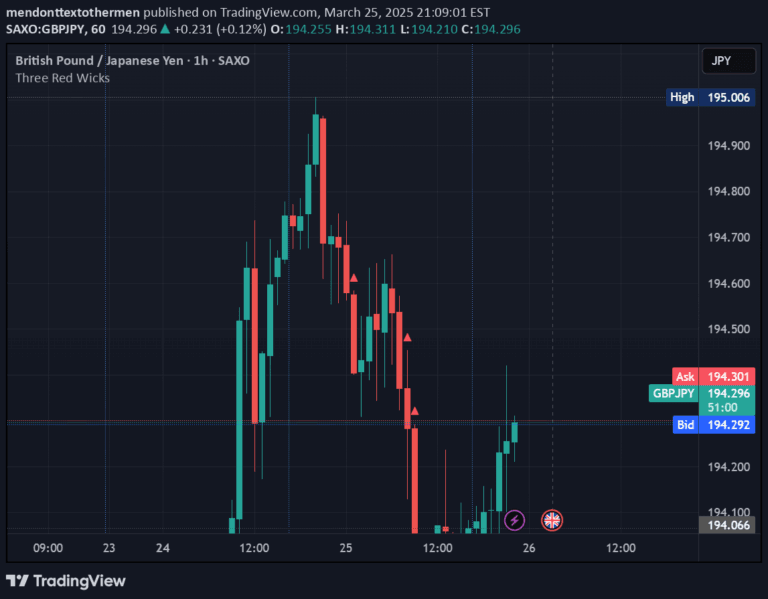
A Supertrend-based indicator that analyzes consecutive candlestick patterns and predicts potential bullish or bearish movements using advanced probabilistic calculations.
Explore complementary indicator rolesHow it works
The Pro Supertrend Calculator first computes the Supertrend indicator using Average True Range (ATR) length and a factor parameter to establish trend lines. It tracks consecutive candlesticks that consistently close above or below these Supertrend lines, creating a systematic method for analyzing price movement patterns.
By meticulously tracking these sequential candle behaviors, the indicator generates visual labels on the price chart to highlight trend continuity. It simultaneously builds a comprehensive statistical table that quantifies consecutive candle trends, providing traders with detailed insights into potential future price dynamics.
Why it may be useful
This indicator offers traders a data-driven approach to understanding market momentum by transforming complex price movement data into actionable insights. It bridges the gap between raw price information and strategic decision-making by providing probabilistic predictions about upcoming candlestick behaviors.
By presenting both visual and numerical representations of market trends, the Pro Supertrend Calculator empowers traders to make more informed decisions. Its ability to calculate the likelihood of bullish or bearish movements gives traders a strategic advantage in navigating uncertain market conditions.
When to explore it
The Pro Supertrend Calculator is most effective in markets with clear, trending price movements where consecutive candle patterns become more predictable. It performs optimally in volatile markets where rapid price changes create opportunities for quick trend identification and potential trade entries.
Traders should consider using this indicator in timeframes ranging from minutes to hours, particularly in markets like forex, stocks, and cryptocurrencies that exhibit strong directional movements. Its customizable parameters allow adaptation to different market conditions and individual trading strategies.
Keep exploring
What we’ve verified
Access, alerts and repainting behaviour have not been independently verified for this indicator. Check the creator’s current publication and settings.
General descriptions and classifications are recovered research. Verified details above identify the specific checks we have completed. Check the creator’s current publication for later changes.