
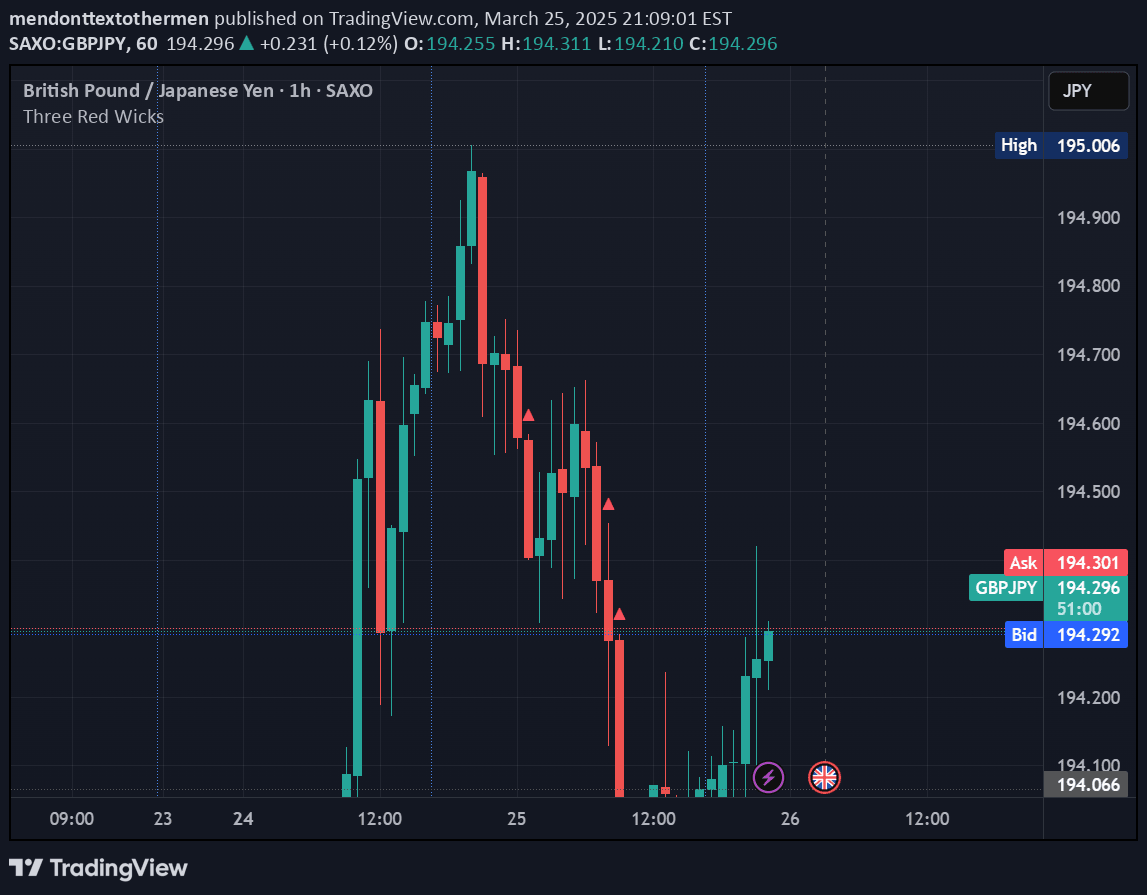
A trading signal that identifies a potential bearish trend by marking chart locations where three consecutive red candles appear, signaling possible downward price movement and potential selling opportunities.
Explore complementary indicator rolesHow it works
The indicator scans the price chart for a specific candlestick pattern where three consecutive red candles appear in sequence. When this pattern is detected, the indicator automatically marks the location on the chart using a predefined shape or marker.
Each red candle represents a period where the closing price is lower than the opening price, suggesting downward price momentum. The consecutive appearance of three such candles indicates a potential strengthening bearish trend. Traders can use this visual marker to quickly identify potential trend reversals or continuation of a downward price movement
Why it may be useful
This signal is crucial for traders seeking to identify potential bearish trends quickly and efficiently. By highlighting areas of consecutive price decline, the indicator helps traders make informed decisions about potential short positions or exit strategies.
The visual marker provides an immediate and intuitive way to recognize price momentum shifts without complex calculations. It simplifies trend analysis by reducing the need for manual chart scanning. Traders can use this signal as an early warning system for potential trend changes, enhancing their technical analysis toolkit
When to explore it
The indicator works best in markets with clear directional movements and moderate volatility. It is particularly effective in stock, forex, and cryptocurrency markets where price trends can develop quickly.
Traders should use this signal in conjunction with other technical indicators to confirm trend strength and potential reversals. It is most reliable in timeframes ranging from 1-hour to daily charts. The signal may be less effective in highly choppy or range-bound markets where price movements are less consistent
Keep exploring
What we’ve verified
Access, alerts and repainting behaviour have not been independently verified for this indicator. Check the creator’s current publication and settings.
General descriptions and classifications are recovered research. Verified details above identify the specific checks we have completed. Check the creator’s current publication for later changes.


