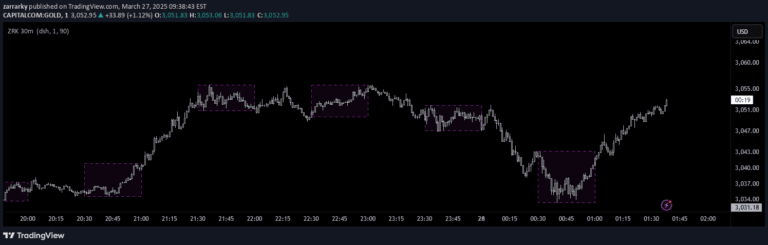
A dynamic trading strategy using rolling pivot range from three previous candles to identify potential market entry points based on support and resistance levels.
Explore complementary indicator rolesHow it works
The strategy calculates a rolling pivot range by analyzing the high, low, and close prices of the three previous candles. It determines a dynamic pivot point by averaging these prices and creates upper and lower range boundaries using a pivot differential calculation.
Traders then use these rolling pivot range levels to identify potential entry points. A long entry occurs when the current close is above both the rolling pivot range high and the rolling pivot, while a short entry happens when the current close is below these levels.
Why it may be useful
This trading approach provides a flexible and adaptive method for identifying potential market reversals and entry points. By using a rolling calculation based on recent price action, the strategy can quickly respond to changing market conditions and provide more dynamic support and resistance levels.
The rolling pivot range helps traders make more informed decisions by offering a nuanced view of market momentum and potential trend changes. It allows for a more responsive trading strategy compared to static support and resistance levels.
When to explore it
The rolling pivot range strategy works best in markets with clear short-term price trends and moderate volatility. It is particularly effective in financial instruments that exhibit consistent price movement patterns and have sufficient trading volume.
Traders should consider using this strategy during periods of stable market conditions where price action demonstrates predictable short-term behavior. It is most suitable for intraday and scalping timeframes, where quick decision-making and rapid market assessment are crucial.
Keep exploring
What we’ve verified
Access, alerts and repainting behaviour have not been independently verified for this indicator. Check the creator’s current publication and settings.
General descriptions and classifications are recovered research. Verified details above identify the specific checks we have completed. Check the creator’s current publication for later changes.