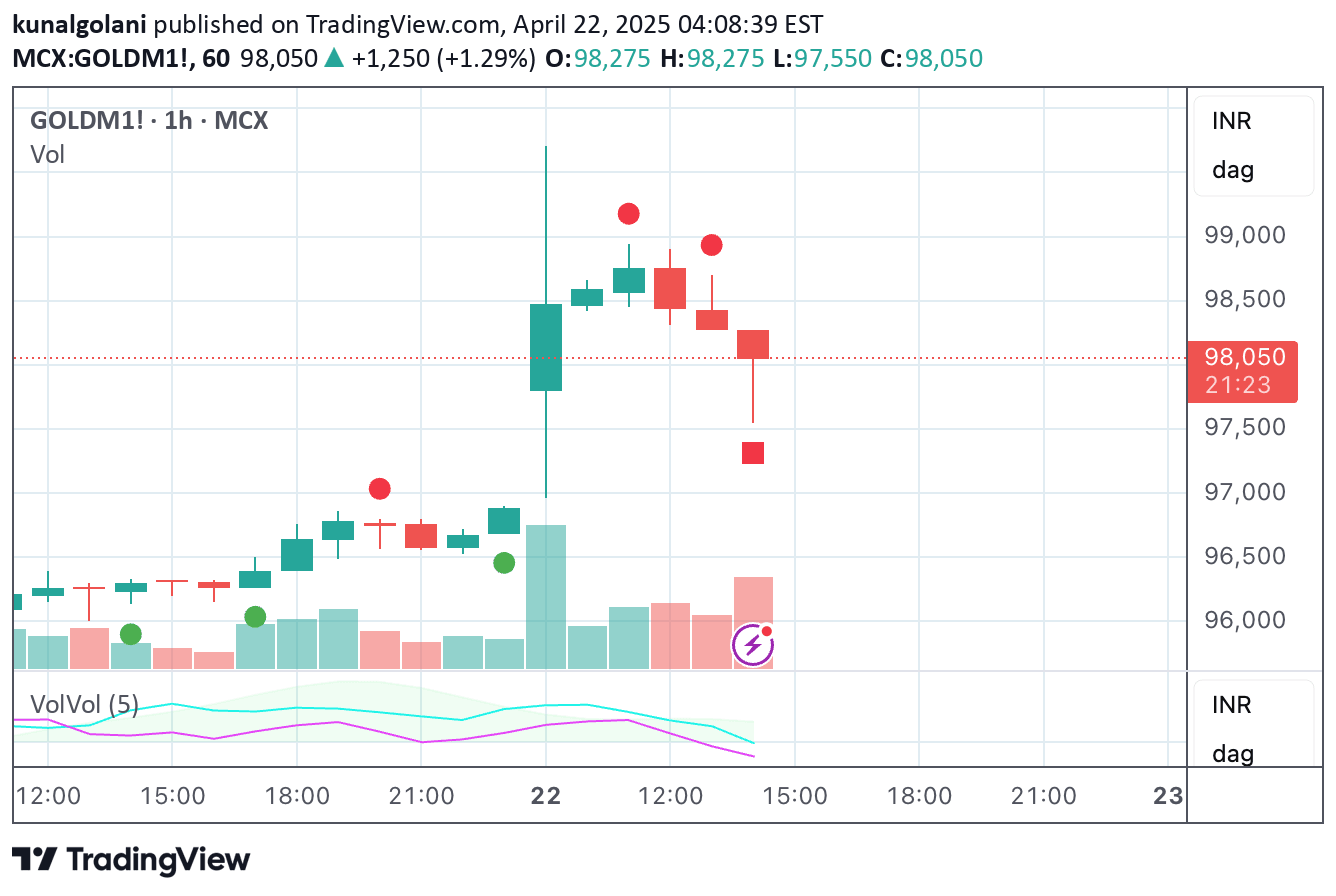
A volume-based MACD indicator that confirms trend strength by analyzing trading volume differences using smoothed moving averages across multiple timeframes.
Explore complementary indicator rolesHow it works
The Volume Wave Trend Confirmation indicator modifies the traditional MACD by focusing on volume instead of price. It calculates two smoothed moving averages of trading volumes: a 33-period and a 100-period SMA, computing their difference as the primary input. This volume-based difference then undergoes standard MACD calculations using 12 and 26-period exponential moving averages.
The resulting indicator comprises three key components: a blue MACD line representing volume difference momentum, an orange signal line acting as a trigger mechanism, and a histogram displaying the relationship between these lines. The histogram changes color from blue to purple depending on whether the MACD line is above or below the signal line, providing visual trend confirmation signals.
Why it may be useful
Traditional price-based indicators often overlook the critical role of trading volume in confirming market movements. By integrating volume analysis directly into the MACD framework, traders gain deeper insights into market sentiment and trend reliability. The indicator helps distinguish between genuine trend movements and potentially misleading price actions by measuring the underlying trading activity.
Volume provides crucial context that price alone cannot communicate, revealing the conviction behind market movements. When significant price changes are accompanied by high trading volumes, it suggests stronger market participation and increases the probability of sustained trend continuation. This approach allows traders to make more informed decisions by understanding not just price direction, but the strength of market consensus.
When to explore it
The Volume Wave Trend Confirmation indicator is most effective in markets with clear directional movements and sufficient trading volume. It performs exceptionally well in liquid markets like major stock indices, forex pairs, and highly traded commodities where volume data is robust and representative. Traders should pay special attention to moments when the histogram changes color or shows significant divergence, as these can signal potential trend reversals or momentum shifts.
The indicator is particularly valuable during periods of market transition, such as breakouts from consolidation zones or when transitioning between bullish and bearish market conditions. By providing volume-based confirmation, it helps traders filter out false signals and focus on high-probability trading opportunities across different timeframes and market environments.
Keep exploring
What we’ve verified
Access, alerts and repainting behaviour have not been independently verified for this indicator. Check the creator’s current publication and settings.
General descriptions and classifications are recovered research. Verified details above identify the specific checks we have completed. Check the creator’s current publication for later changes.