
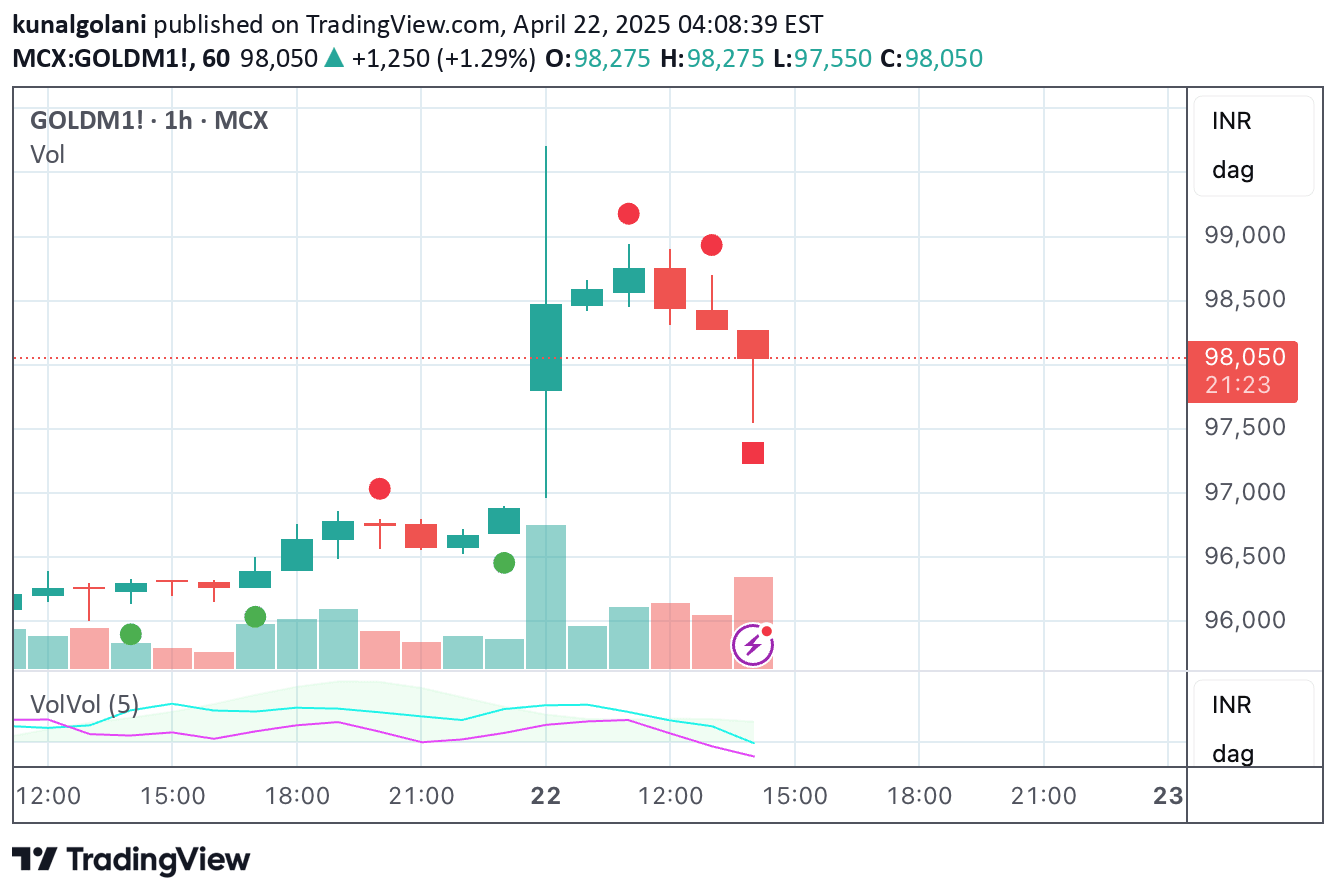
A multi-component volatility and volume indicator that analyzes market direction, intensity, and momentum through oscillating percentage scales to generate trading signals.
Explore complementary indicator rolesHow it works
The VolVol indicator operates through three interconnected components that assess market dynamics using smoothed statistical measurements. The Direction component creates green or red shaded areas representing the smoothened distance between Close price and its Exponential Moving Average (EMA), normalized by standard deviation.
The Intensity and Momentum components further refine the analysis by tracking relative price movements and volume characteristics. Intensity calculates the smoothened distance between Low/High prices and their respective EMAs, while Momentum uses a double exponential average of bullish versus bearish closing volumes to provide additional market insight.
Why it may be useful
The VolVol indicator provides traders with a comprehensive view of market conditions by simultaneously analyzing price volatility, directional momentum, and volume dynamics. Its multi-dimensional approach allows traders to gain deeper insights into potential market movements beyond traditional single-metric indicators.
By integrating direction, intensity, and momentum into a unified framework, the indicator helps traders identify nuanced market conditions that might be missed by more simplistic analytical tools. This holistic perspective enables more informed decision-making and potentially more precise entry and exit strategies.
When to explore it
The VolVol indicator is most effective in markets with clear trending characteristics and sufficient trading volume, making it particularly suitable for highly liquid financial instruments. It performs optimally in timeframes ranging from very short (scalping) to intraday trading, where rapid market fluctuations and volume changes are most pronounced.
Traders should pay special attention to the indicator's signals during periods of market transition, such as potential trend reversals or consolidation phases. The indicator's ability to generate entry, add, and exit signals makes it valuable for traders seeking to capture both trending and ranging market conditions.
Keep exploring
What we’ve verified
Access, alerts and repainting behaviour have not been independently verified for this indicator. Check the creator’s current publication and settings.
General descriptions and classifications are recovered research. Verified details above identify the specific checks we have completed. Check the creator’s current publication for later changes.



