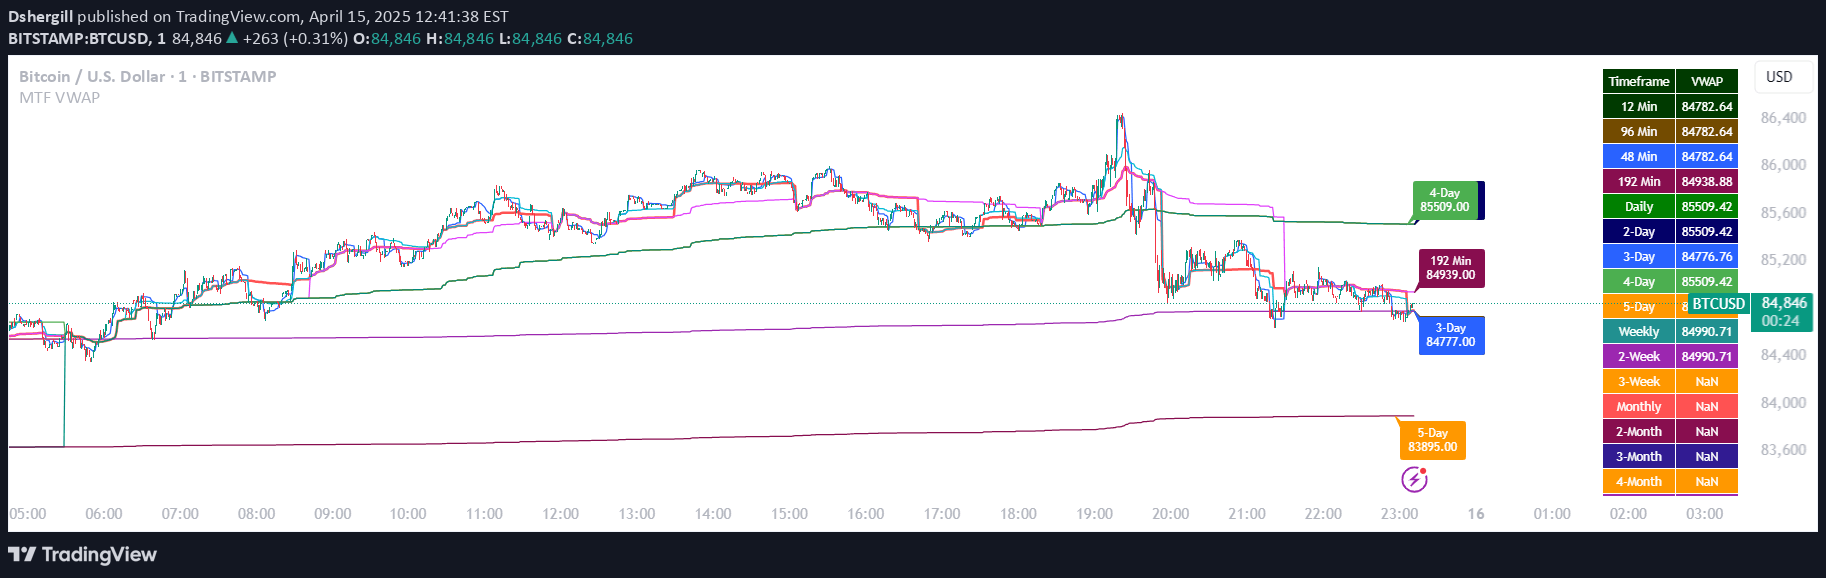
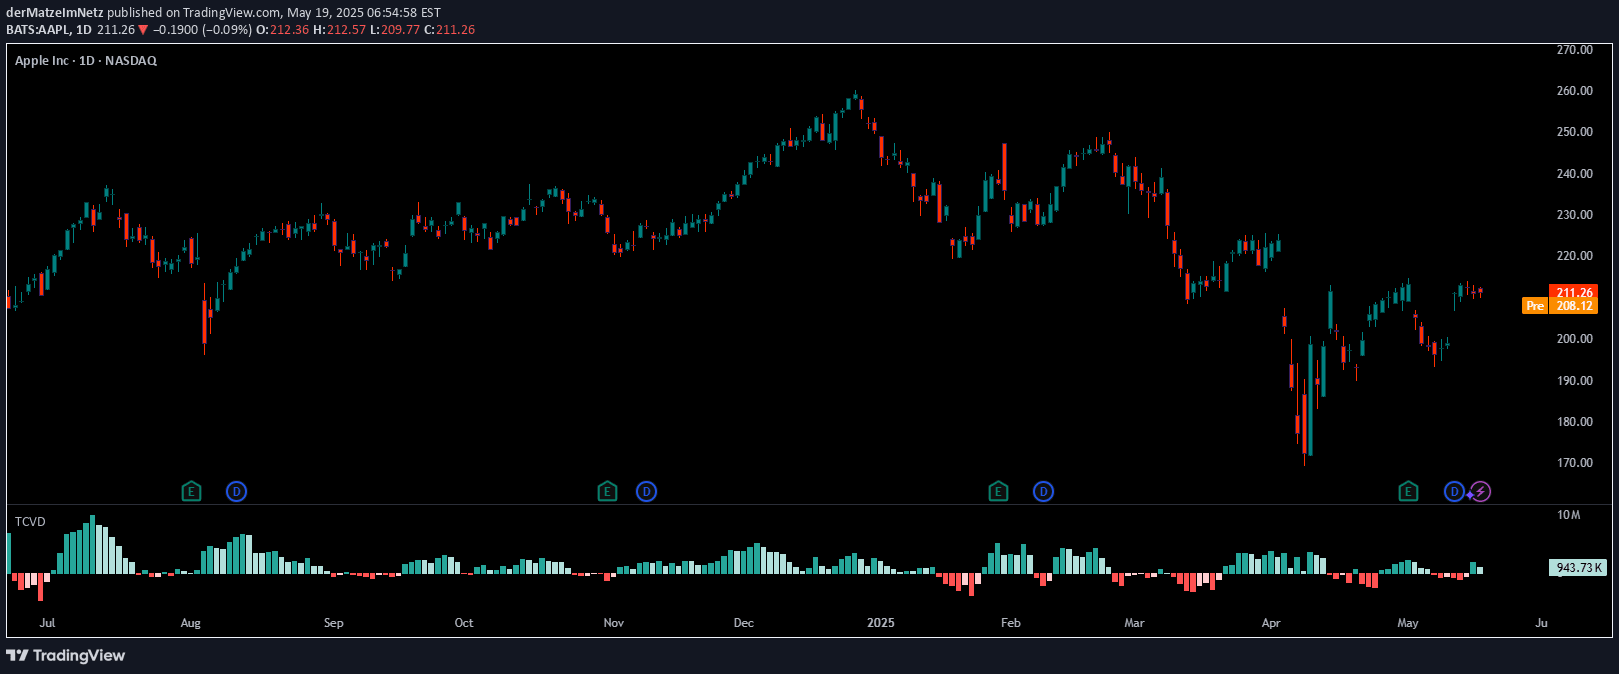
VWMP is a volume-weighted median price indicator that finds the price level where 50% of trading volume occurs above and below, offering a robust market insight.
Explore complementary indicator rolesHow it works
The Volume Weighted Median Price (VWMP) calculates a unique median price level by sorting all trades within a lookback period and identifying the price point where exactly half the total volume has traded. Unlike traditional average price calculations, VWMP arranges trades by price and accumulates volume until the midpoint is reached, effectively finding the central price where trading activity is balanced.
Traders can customize the lookback period to make the VWMP more responsive or smoother. A shorter period will create a more dynamic line that quickly reflects recent trading activity, while a longer period generates a more stable line representing broader volume distribution across the timeframe.
Why it may be useful
The VWMP provides traders with a more robust alternative to VWAP by reducing the impact of outlier trades that can skew traditional volume-weighted averages. It offers a clearer representation of where significant trading volume is concentrated, helping traders understand the true market sentiment and potential support or resistance levels.
By identifying the median price where trading volume is evenly distributed, the VWMP helps traders gauge market dynamics more accurately. It serves as a dynamic reference point that can reveal underlying market strength, weakness, and potential trend continuation or reversal signals.
When to explore it
The VWMP is most effective in markets with significant volume and price movement, such as liquid stocks, futures, and forex pairs. Traders can use it during trending markets to confirm trend direction by observing how price interacts with the VWMP line, with consistent price placement above or below indicating bullish or bearish control respectively.
Traders should combine VWMP with other technical indicators and analysis tools to validate potential trading signals. It works particularly well when there's confluence with other technical levels like Fibonacci retracements, moving averages, or established support and resistance zones.
Keep exploring
What we’ve verified
Access, alerts and repainting behaviour have not been independently verified for this indicator. Check the creator’s current publication and settings.
General descriptions and classifications are recovered research. Verified details above identify the specific checks we have completed. Check the creator’s current publication for later changes.