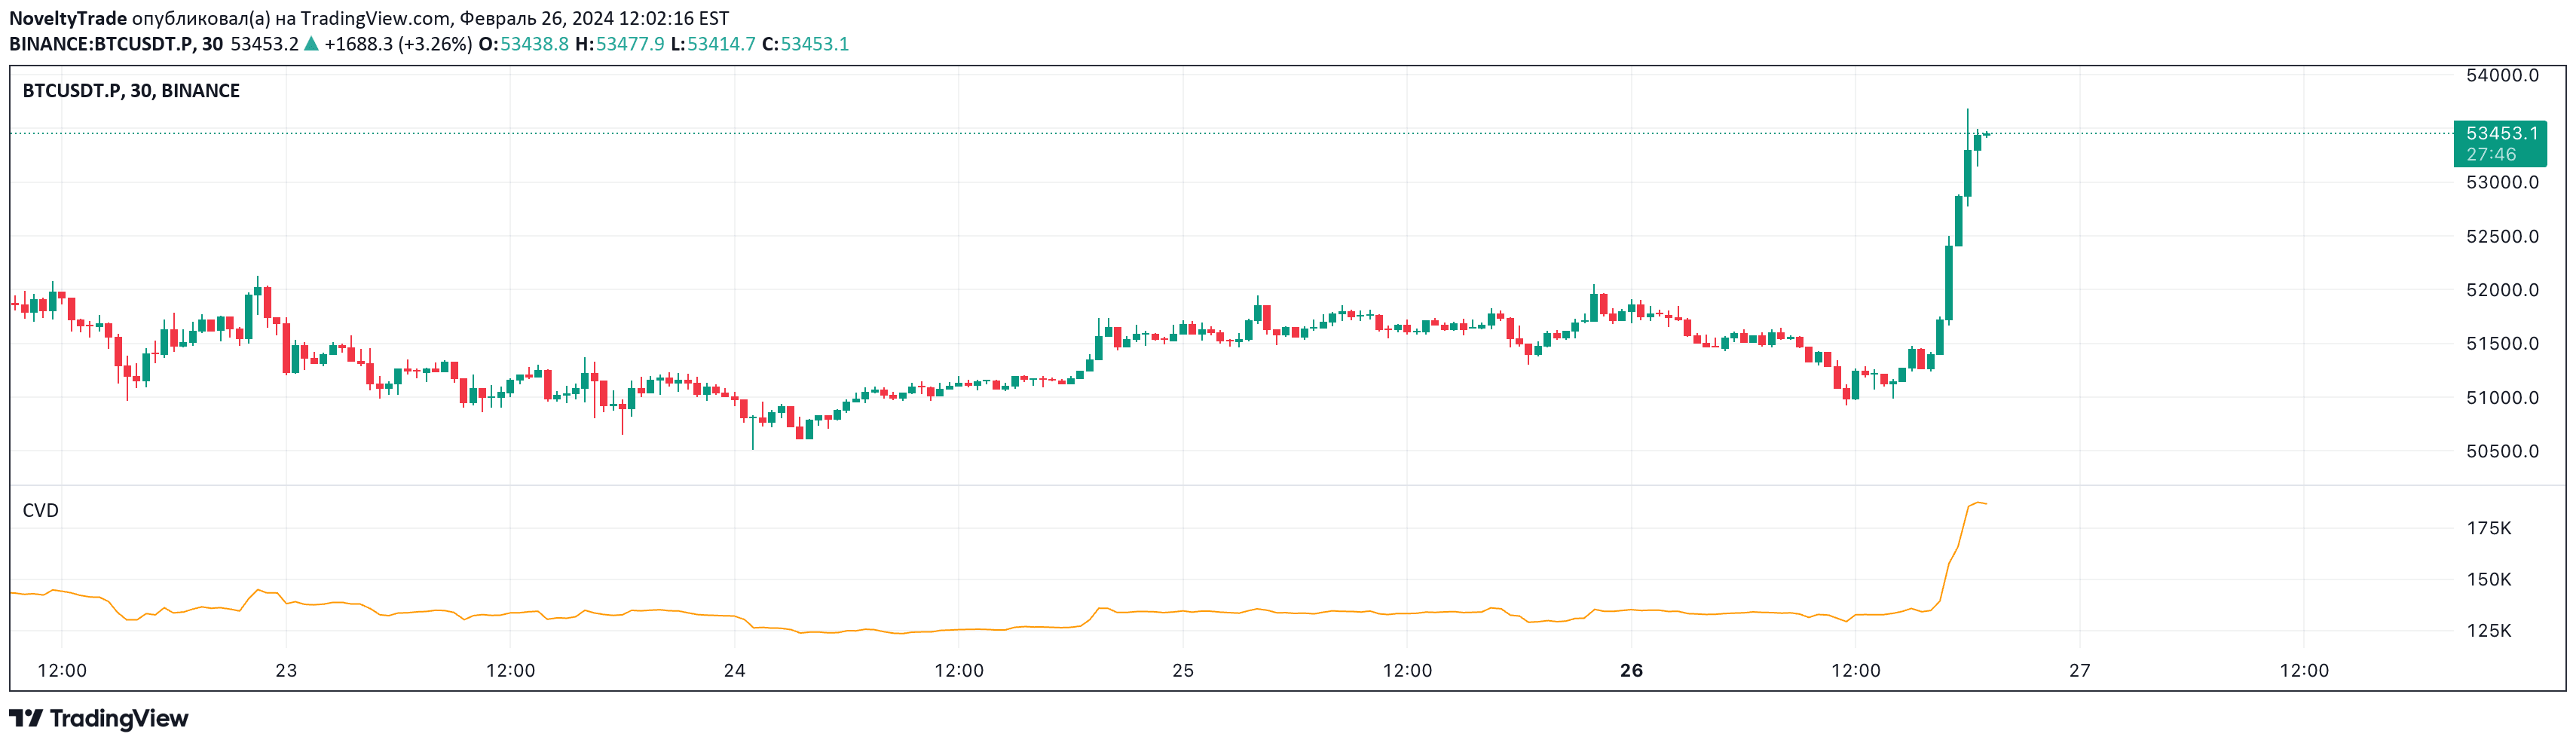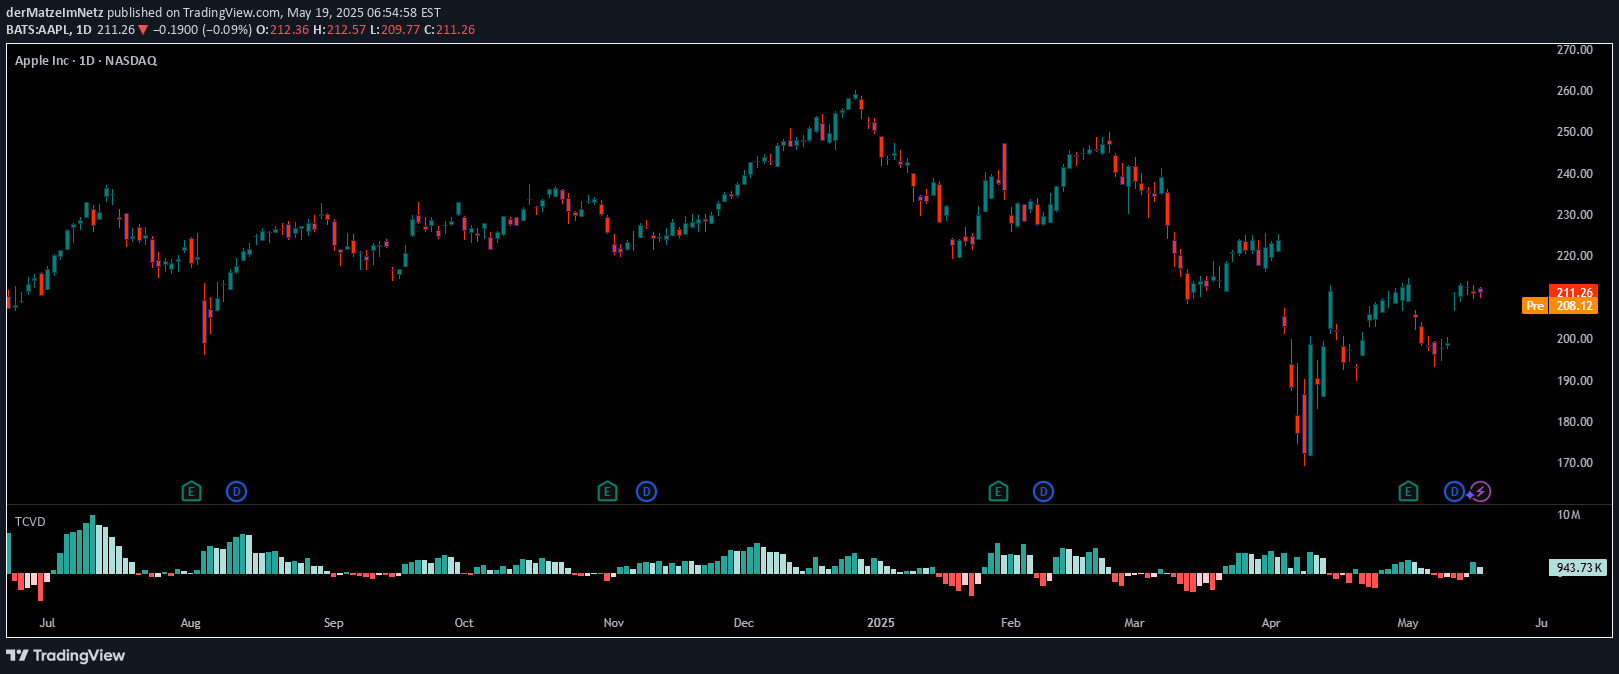
A dynamic volume delta indicator that calculates trailing net buying/selling pressure, offering an adaptive view of order flow momentum across multiple timeframes.
Explore complementary indicator rolesHow it works
The Trailing Cumulative Volume Delta (TCVD) calculates net volume delta by analyzing aggressive buying and selling volume at a lower timeframe. It computes the net delta for each individual bar, then sums these values over a user-defined number of recent bars to create a trailing indicator of order flow momentum.
By using a configurable lookback period, the TCVD provides traders with a flexible tool that can adapt to different market conditions and trading styles. The indicator dynamically tracks the balance between buying and selling pressure, presenting this information through color-coded columns that represent increasing or decreasing market sentiment.
Why it may be useful
The TCVD offers traders a nuanced view of market dynamics by revealing underlying order flow strength beyond simple price movement. It provides insights into whether buying or selling pressure is dominating the market, helping traders understand the potential sustainability of current price trends.
By tracking volume delta across a trailing period, the indicator can help identify potential trend reversals, confirm breakouts, and provide early signals of shifting market sentiment. This makes it a valuable tool for understanding the hidden dynamics of market participation and potential future price movements.
When to explore it
The TCVD works best in markets with consistent volume data and during periods of clear directional movement. It is particularly effective for confirming breakouts, identifying potential trend strength, and understanding the underlying momentum of price action.
Traders should use the TCVD in conjunction with other technical analysis tools, adjusting its trailing bars and timeframe settings to match their specific trading style and the characteristics of the asset being traded. It is most reliable when used across liquid markets with robust volume information.
Keep exploring
What we’ve verified
Access, alerts and repainting behaviour have not been independently verified for this indicator. Check the creator’s current publication and settings.
General descriptions and classifications are recovered research. Verified details above identify the specific checks we have completed. Check the creator’s current publication for later changes.