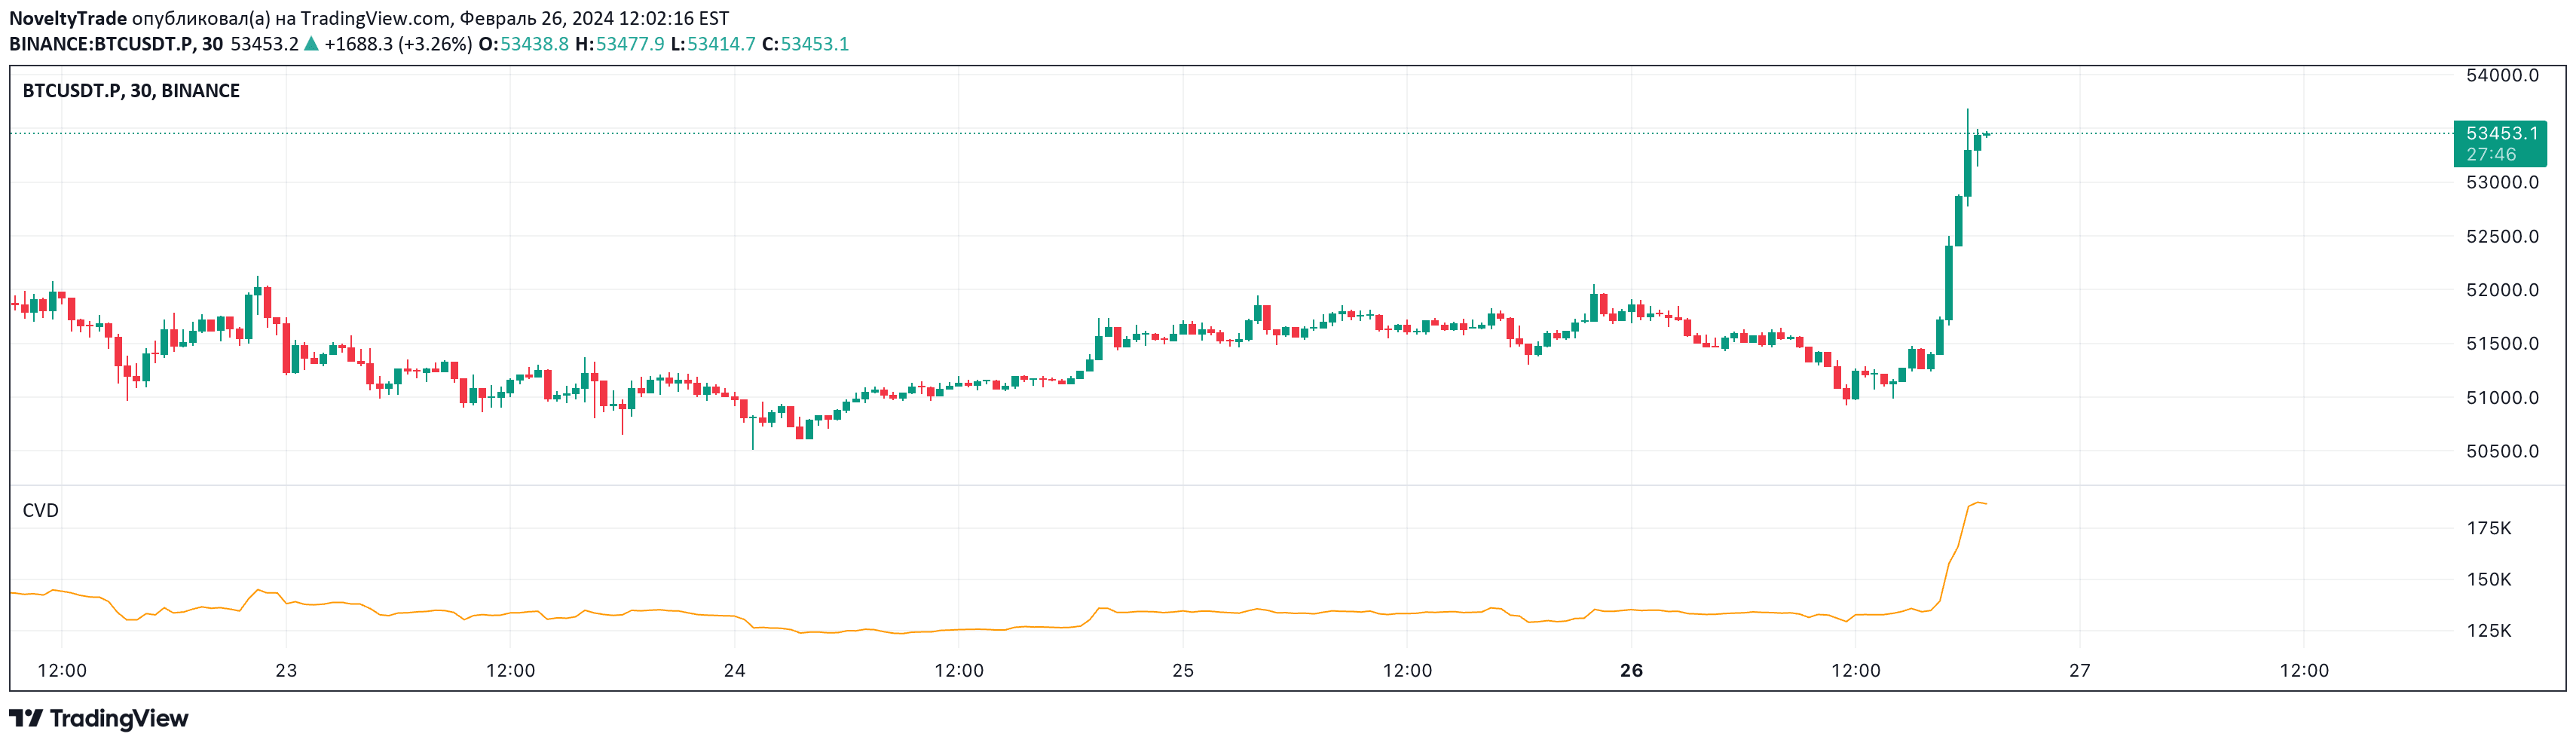
A refined Cumulative Volume Delta (CVD) indicator that adapts between line chart and oscillator modes, providing insights into buying and selling pressure across different timeframes.
Explore complementary indicator rolesHow it works
The Cumulative Volume Delta (CVD) indicator calculates the difference between buying and selling volume within a specified period, tracking the net buying or selling pressure. It aggregates volume delta over time, creating a running total that shows the cumulative buying and selling activities in the market.
The script intelligently switches between a CVD line for lower timeframes and a Simple Moving Average (SMA) for daily and higher timeframes. This adaptive approach ensures accurate volume delta representation across different trading periods, leveraging TradingView's precise calculations to provide a comprehensive view of market volume dynamics.
Why it may be useful
Volume Delta provides crucial insights into market sentiment by revealing the underlying buying and selling pressure that drives price movements. By understanding the net volume flow, traders can gain a deeper understanding of market dynamics beyond simple price action, helping to identify potential trend reversals or continuations.
The indicator's flexibility in displaying data as a line chart or oscillator makes it a versatile tool for traders across different trading styles and timeframes. Its ability to automatically adapt between CVD and SMA representations ensures that traders can effectively analyze volume dynamics regardless of the chosen trading period.
When to explore it
The CVD indicator is most effective when used in conjunction with price action analysis, particularly during periods of potential trend reversals or breakouts. Traders can use it to confirm existing trends or identify divergences that might signal upcoming market changes, especially in volatile or range-bound market conditions.
It is particularly useful for intraday traders who need to quickly assess buying and selling pressure, as well as swing traders looking to understand longer-term volume trends. The indicator's adaptability makes it valuable across multiple timeframes, from short-term scalping to longer-term swing trading strategies.
Keep exploring
What we’ve verified
Access, alerts and repainting behaviour have not been independently verified for this indicator. Check the creator’s current publication and settings.
General descriptions and classifications are recovered research. Verified details above identify the specific checks we have completed. Check the creator’s current publication for later changes.