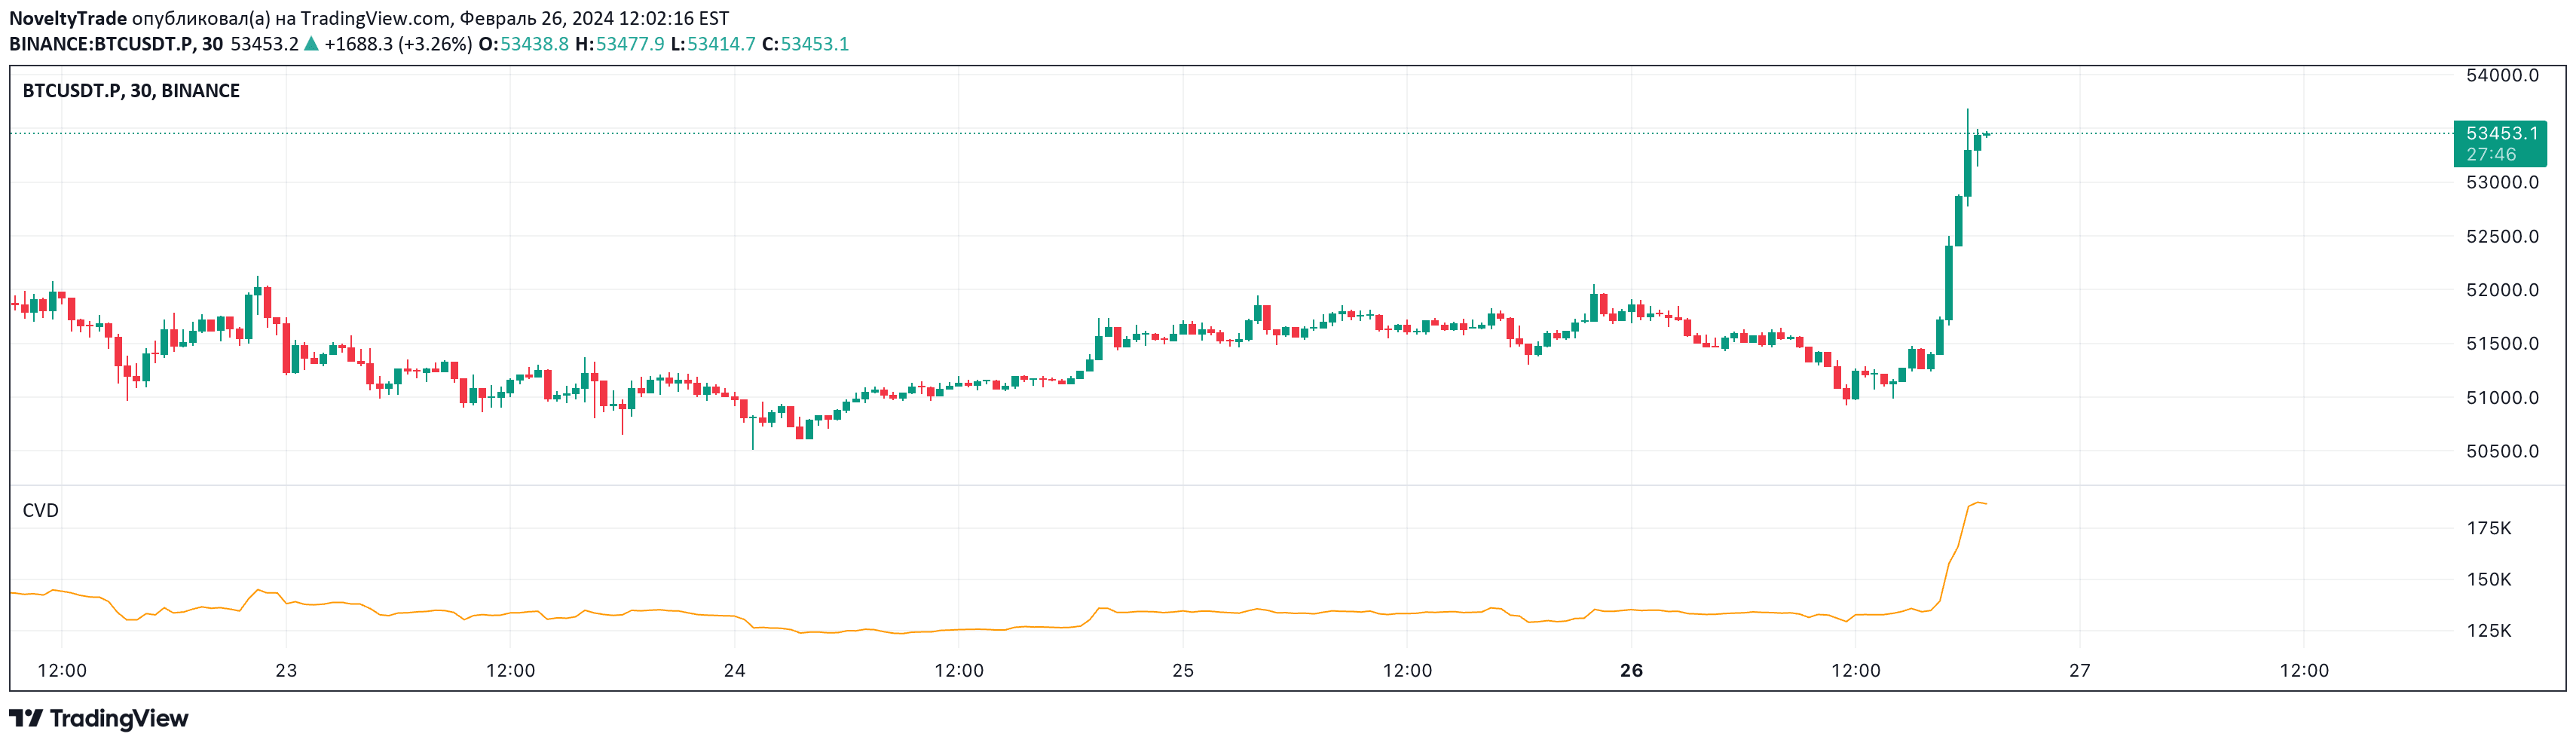
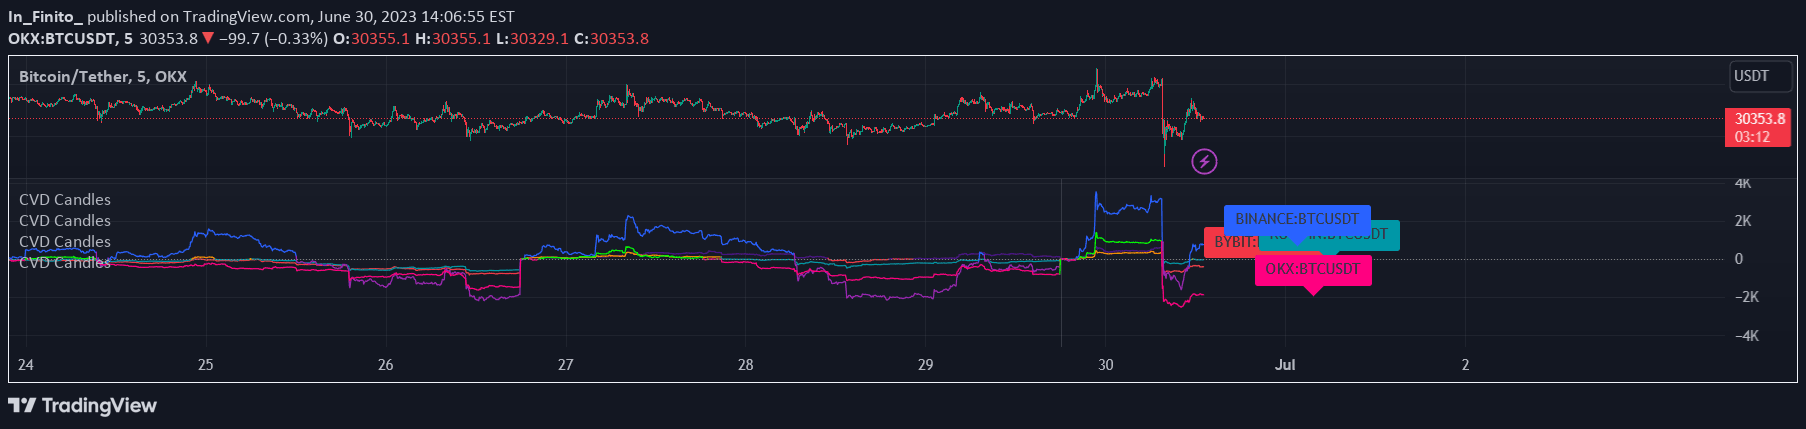
Cumulative Volume Delta (CVD) indicator tracks the net buying and selling pressure across multiple cryptocurrency exchanges, providing insights into market sentiment and volume dynamics.
Explore complementary indicator rolesHow it works
The Cumulative Volume Delta (CVD) uses intrabar analysis to calculate the difference between buying and selling pressure across multiple exchanges. It aggregates volume data from platforms like Binance, Bybit, and OKX, creating a comprehensive view of market volume dynamics.
The indicator can be displayed in two formats: candle type and line type, allowing traders to visualize volume delta in different visual representations. Users can choose between aggregated data from multiple exchanges or single exchange data based on their specific trading needs and preferences.
Why it may be useful
The CVD indicator provides traders with a critical understanding of market sentiment by revealing the net flow of buying and selling pressure. By aggregating volume data across multiple exchanges, it offers a more comprehensive view of market dynamics than single-exchange volume analysis.
This approach helps traders identify potential trend strength, confirm price movements, and understand underlying market sentiment. The ability to switch between aggregated and single data types makes it a versatile tool for cryptocurrency traders seeking deeper insights into market volume and momentum.
When to explore it
The CVD indicator is most effective when trading cryptocurrency pairs, particularly Bitcoin (BTC) pairs where aggregated data is most robust. It works best in volatile market conditions where volume analysis can provide meaningful insights into potential price movements and market sentiment.
Traders should use this indicator in conjunction with other technical analysis tools to confirm signals and make more informed trading decisions. It is particularly useful for short-term trading strategies like scalping and day trading, where understanding immediate volume dynamics can provide a competitive edge.
Keep exploring
What we’ve verified
Access, alerts and repainting behaviour have not been independently verified for this indicator. Check the creator’s current publication and settings.
General descriptions and classifications are recovered research. Verified details above identify the specific checks we have completed. Check the creator’s current publication for later changes.