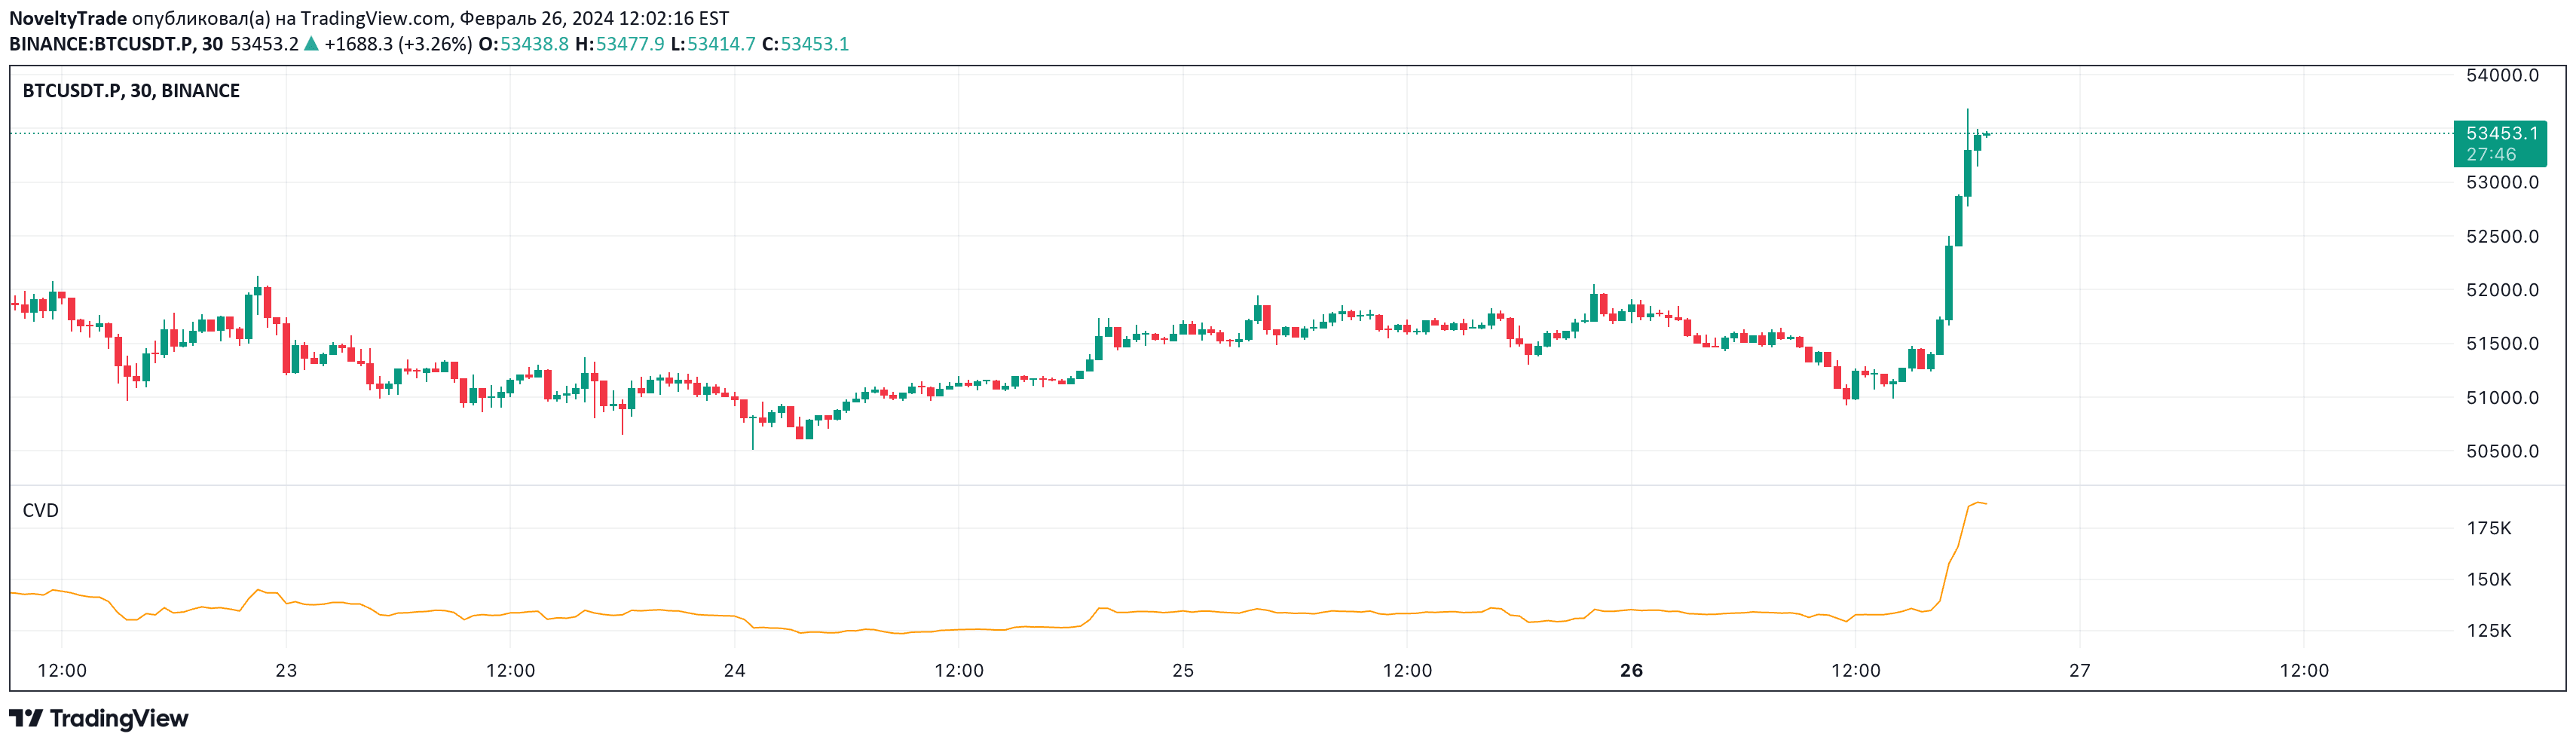
Volume Suite - By Leviathan (CVD, Volume Delta, Relative Volume)
Volume Suite provides multiple volume-based indicators to analyze trading activity, including Volume Delta, CVD, Buy/Sell Volume, and Relative Volume for comprehensive market insights.
Explore 11,183 indicators. Filter beyond the obvious.
Discover the tools that fit the way you trade.
11,183 tools to explore
Volume Suite provides multiple volume-based indicators to analyze trading activity, including Volume Delta, CVD, Buy/Sell Volume, and Relative Volume for comprehensive market insights.
Advanced volume-based trading strategy that identifies trend reversals by analyzing cumulative volume delta with order block and fair value gap entry methods and dynamic risk management.
Volume Delta Methods analyze buying and selling pressure by comparing volume traded at different price levels, providing insights into market sentiment and trade dynamics.
Cumulative Volume Delta (CVD) is a technical analysis tool that tracks buying and selling volume to identify potential price trend reversals and market momentum shifts.
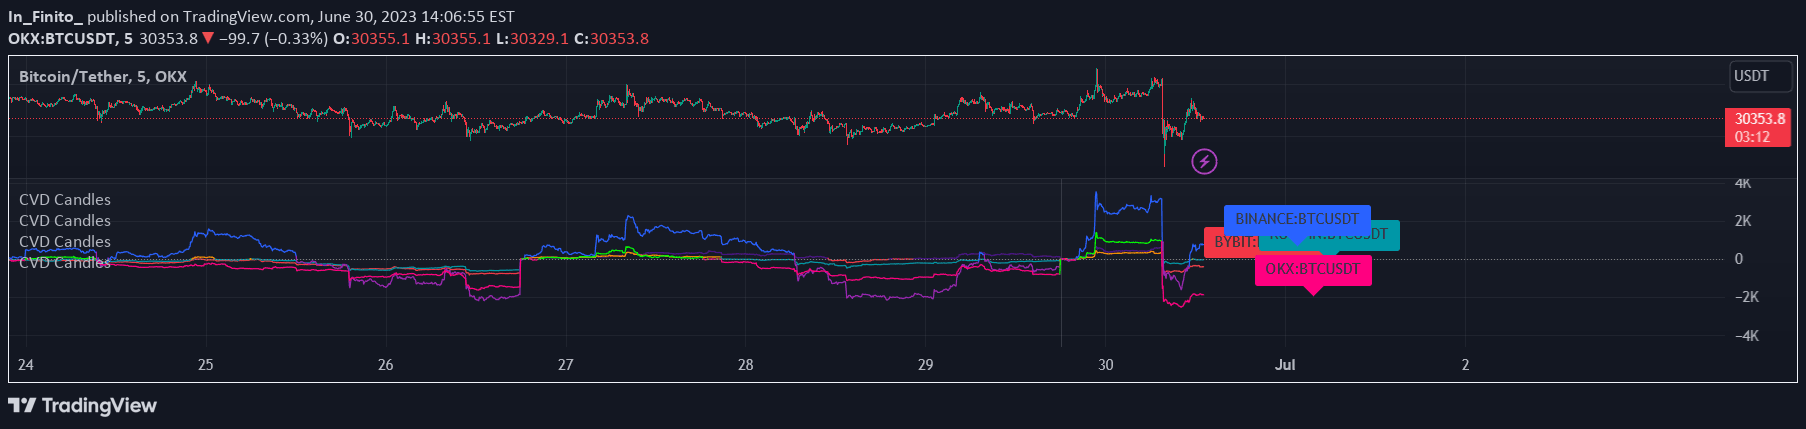
Cumulative Volume Delta (CVD) indicator tracks the net buying and selling pressure across multiple cryptocurrency exchanges, providing insights into market sentiment and volume dynamics.
A refined Cumulative Volume Delta (CVD) indicator that adapts between line chart and oscillator modes, providing insights into buying and selling pressure across different timeframes.
A volume-based indicator measuring the velocity and acceleration of buying and selling volume through Cumulative Volume Delta to detect potential trend changes and market momentum shifts.
Cumulative Volume Delta (CVD) tracks net buying and selling pressure by calculating the running total of volume differences between bullish and bearish price movements.
Enhanced CVD indicator allowing multi-exchange volume flow comparison with customizable symbol selection and normalization capabilities for comprehensive trading analysis.
A Cumulative Delta Volume indicator that visualizes buying and selling pressure through color-coded waves, helping traders understand market momentum and sentiment shifts.
Likes, views, and comments are historical TradingView snapshots. They describe attention, not trading performance.