
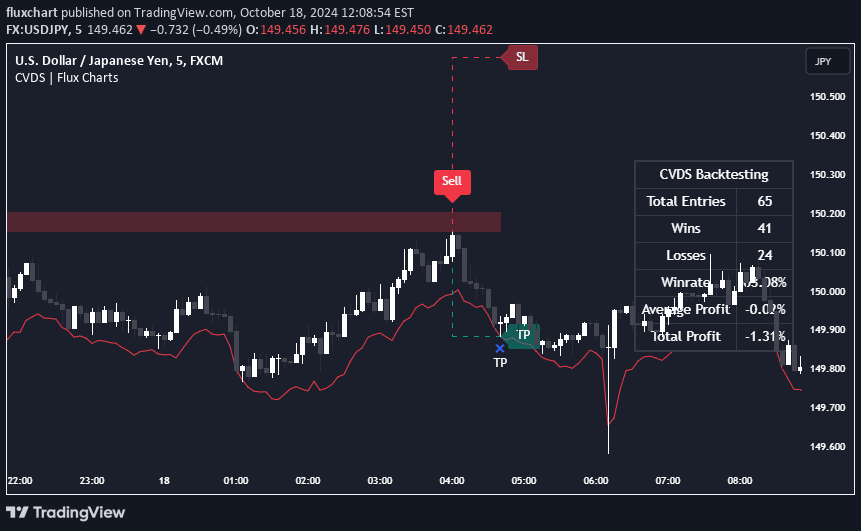
Advanced volume-based trading strategy that identifies trend reversals by analyzing cumulative volume delta with order block and fair value gap entry methods and dynamic risk management.
Explore complementary indicator rolesHow it works
The CVDS indicator tracks the net volume difference between buyers and sellers to identify potential trend reversals by calculating cumulative volume delta. It resets the volume delta sum daily and detects divergences when the cumulative volume crosses the zero-line.
Once a significant divergence is identified, the indicator looks for breakout points confirmed by Fair Value Gaps (FVGs) or Order Blocks (OBs). Depending on the selected entry mode, it triggers buy or sell entries that align with the breakout direction, providing comprehensive trading signals.
Why it may be useful
The CVDS indicator offers traders a sophisticated approach to understanding market dynamics by integrating volume analysis with advanced price action tools. By combining volume divergence with Fair Value Gaps and Order Blocks, traders can gain deeper insights into potential market reversals and entry points.
The dynamic take-profit and stop-loss system adapts to market volatility, providing flexible risk management. This comprehensive approach helps traders filter out market noise and focus on more meaningful trading opportunities across different market conditions.
When to explore it
The CVDS indicator is most effective in markets with clear volume trends and identifiable price action patterns. It works best in liquid markets with consistent trading volumes, such as major forex pairs, stock indices, and popular cryptocurrencies.
Traders should use this indicator when seeking to confirm trend reversals through volume analysis and looking for precise entry points using advanced price action techniques. It is particularly useful for day and swing traders who want a comprehensive tool that combines multiple analytical approaches.
Keep exploring
What we’ve verified
Access, alerts and repainting behaviour have not been independently verified for this indicator. Check the creator’s current publication and settings.
General descriptions and classifications are recovered research. Verified details above identify the specific checks we have completed. Check the creator’s current publication for later changes.


