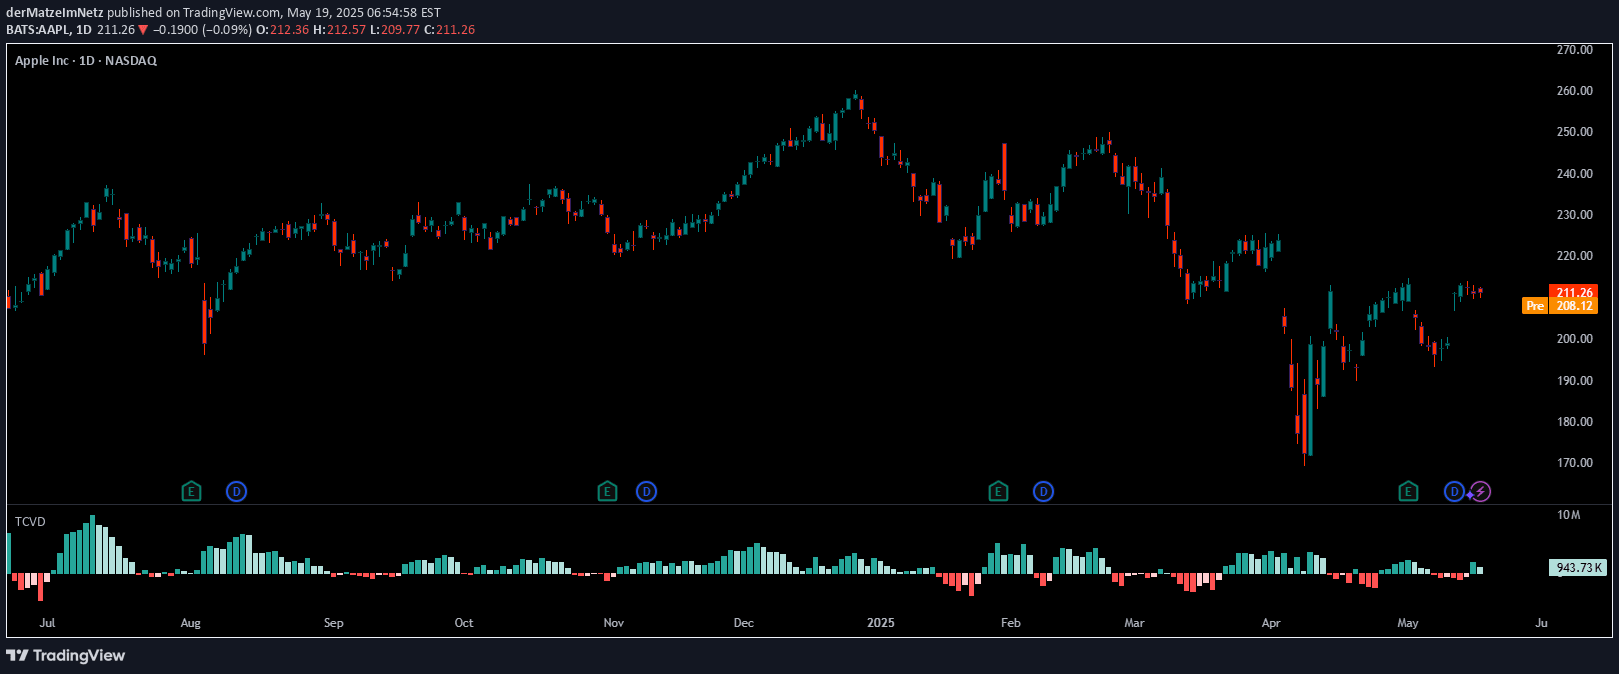
A Cumulative Delta Volume indicator that visualizes buying and selling pressure through color-coded waves, helping traders understand market momentum and sentiment shifts.
Explore complementary indicator rolesHow it works
The Cumulative Delta Volume (CDV) indicator calculates the net difference between buying and selling volume, presenting this data as color-coded waves on the chart. It tracks the cumulative volume pressure by comparing volume at different price levels, with green waves representing buying pressure and red waves indicating selling momentum.
The indicator uses a mul2 sensitivity setting that allows traders to adjust the wave responsiveness for different trading timeframes. By shifting the wave positioning through the osx setting, traders can fine-tune the visual representation to align with their specific analysis preferences and market interpretation strategies.
Why it may be useful
The CDV indicator provides traders with a visual representation of market sentiment, revealing the underlying strength of buying and selling pressures that might not be immediately apparent from price action alone. By translating volume dynamics into intuitive color-coded waves, it helps traders quickly understand momentum shifts and potential trend reversals.
This tool is particularly valuable because it offers a nuanced view of market psychology, showing not just price movement but the actual volume-driven sentiment behind those movements. Traders can use these insights to confirm trends, detect potential market turning points, and make more informed trading decisions across different market conditions.
When to explore it
The Cumulative Delta Volume indicator is most effective in markets with clear volume trends and significant price movements, such as during breakouts, trend confirmations, and potential reversal scenarios. It works best in liquid markets with consistent trading volume, where the buying and selling pressures can be more distinctly observed.
Traders should utilize this indicator in conjunction with other technical analysis tools to validate signals and reduce false interpretations. It is particularly useful in volatile markets where understanding the underlying volume dynamics can provide critical insights into potential price direction and market sentiment.
Keep exploring
What we’ve verified
Access, alerts and repainting behaviour have not been independently verified for this indicator. Check the creator’s current publication and settings.
General descriptions and classifications are recovered research. Verified details above identify the specific checks we have completed. Check the creator’s current publication for later changes.