YOUR INDICATOR RESEARCH STARTS HERE

Find the right indicator.
Understand what it does.

Explore 11,183 indicators. Filter beyond the obvious.
Discover the tools that fit the way you trade.

THE INDICATOR LIBRARY

Results for “waves”

11,183 tools to explore

89 indicators matching your filters
Save search
TrendMomentumEditor’s pick

Elliott Wave [LuxAlgo]

by LuxAlgo

Elliott Wave indicator automatically detects impulse and corrective wave patterns in price movements, helping traders identify potential trend directions and market phases.

Main price chart · unverifiedDay Trading · Swing Trading
Explore
11.4Klikes476Kviews157comments

Save
TrendMomentumEditor’s pick

Trading ABC

by LonesomeTheBlue

An advanced pattern recognition indicator that identifies ABC chart patterns using trend cloud, ZigZag, and Fibonacci levels to detect potential trading opportunities with customizable settings.

Main price chart · unverifiedDay Trading · Swing Trading
Explore
9.6Klikes190.9Kviews109comments
Save
TrendVolatilityEditor’s pick

Renko Candles Overlay

by LonesomeTheBlue

Renko Candles Overlay is a charting technique that transforms price action into uniform-sized bricks, offering a simplified visual representation of market trends and price movements.

Main price chart · unverifiedDay Trading · Swing Trading
Explore
6.6Klikes169.7Kviews135comments
Save
TrendMomentumEditor’s pick

Ichimoku Theories [LuxAlgo]

by LuxAlgo

A comprehensive Ichimoku trading tool that combines multiple theories to analyze market trends, cycles, waves, and potential price targets using advanced Japanese technical analysis techniques.

Main price chart · unverifiedSwing Trading
Explore
4.9Klikes159.9Kviews40comments
Save
MomentumEditor’s pick

Stochastic Heat Map

by Violent

A multi-timeframe stochastic oscillator system using 28 different stochastic lengths to analyze market momentum and generate trading signals through color-coded visualization.

Separate pane · unverifiedSwing Trading
Explore
4.2Klikes121.6Kviews87comments
Save
TrendMomentumEditor’s pick

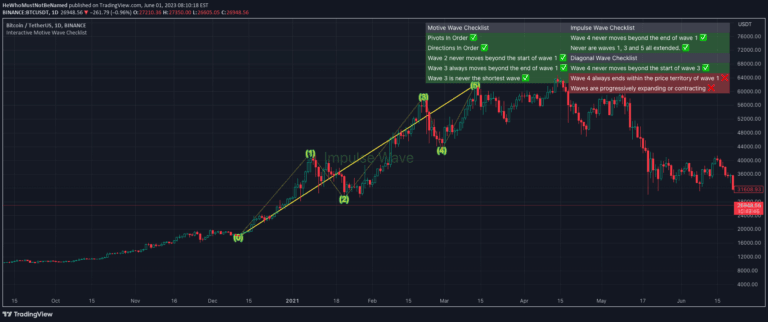
Interactive Motive Wave Checklist

by Trendoscope

Elliott Wave analysis is a technical trading method that identifies market trends by examining price wave patterns, helping traders predict potential market movements and trend reversals.

Main price chart · unverifiedDay Trading · Swing Trading
Explore
2.3Klikes55.2Kviews25comments
Save
MomentumOscillatorSignal

MACD Fake Filter [RH]

by HasanRifat

An advanced MACD indicator that analyzes positive and negative waves to filter false crossover signals and provide enhanced trading insights through wave height analysis.

Separate pane · unverifiedScalping · Day Trading
Explore
1.7Klikes34.7Kviews28comments
Save
TrendSignalPatterns

Flags and Pennants [Trendoscope®]

by Trendoscope

Chart pattern analysis focusing on flag and pennant formations that identify potential trend continuation after strong impulse waves, helping traders anticipate market momentum.

Main price chart · unverifiedScalping · Day Trading
Explore
1.7Klikes24.3Kviews13comments
Save
TrendMomentumEditor’s pick

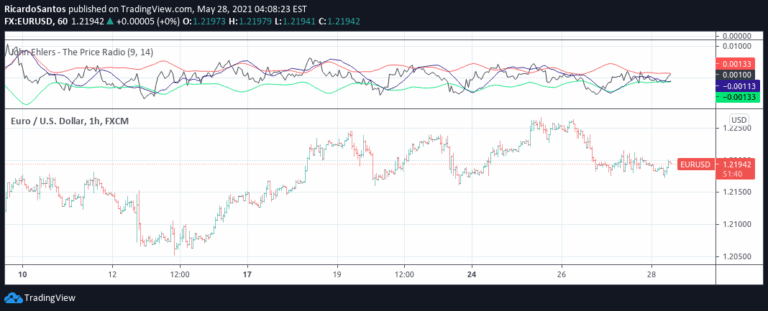
John Ehlers - The Price Radio

by RicardoSantos

An innovative signal processing technique that treats price curves like radio waves, using AM and FM demodulation to extract trading signals from market noise.

Main price chart · unverifiedDay Trading · Swing Trading
Explore
1.6Klikes37.1Kviews31comments
Save

Likes, views, and comments are historical TradingView snapshots. They describe attention, not trading performance.

START WITH A QUESTION

A little less searching.
A lot more understanding.

Tell DeepAlpha what you need. Get an explanation, a shortlist,
and a direct path to the indicators behind it.

Ask DeepAlpha