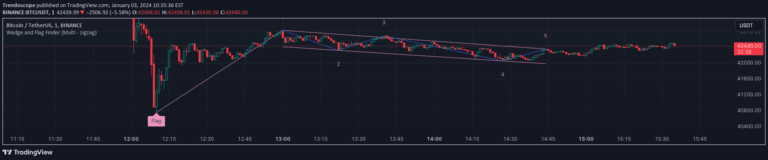
Elliott Wave analysis is a technical trading method that identifies market trends by examining price wave patterns, helping traders predict potential market movements and trend reversals.
Explore complementary indicator rolesHow it works
Elliott Wave analysis involves identifying six pivotal points on a price chart to determine if a market movement follows a specific wave pattern. Traders select points that represent wave highs and lows, then evaluate these points against strict rules for motive waves.
The method checks wave progressions, directions, lengths, and retracements to validate potential impulse or diagonal wave structures. It requires precise pivot point selection and careful analysis of wave relationships
Why it may be useful
Elliott Wave analysis provides traders with a sophisticated framework for understanding market psychology and potential future price movements.
By recognizing specific wave patterns, traders can anticipate trend reversals, assess market momentum, and make more informed trading decisions. The method offers insights into market sentiment, helping traders identify potential entry and exit points with greater precision and confidence
When to explore it
Elliott Wave analysis works best in markets with clear trend structures, such as forex, stock indices, and cryptocurrencies. Traders should apply this method during trending markets with sufficient price volatility.
It is most effective when markets demonstrate consistent directional movements and when multiple timeframes confirm the wave pattern. Traders should combine Elliott Wave analysis with other technical indicators to validate signals
Keep exploring
What we’ve verified
Access, alerts and repainting behaviour have not been independently verified for this indicator. Check the creator’s current publication and settings.
General descriptions and classifications are recovered research. Verified details above identify the specific checks we have completed. Check the creator’s current publication for later changes.