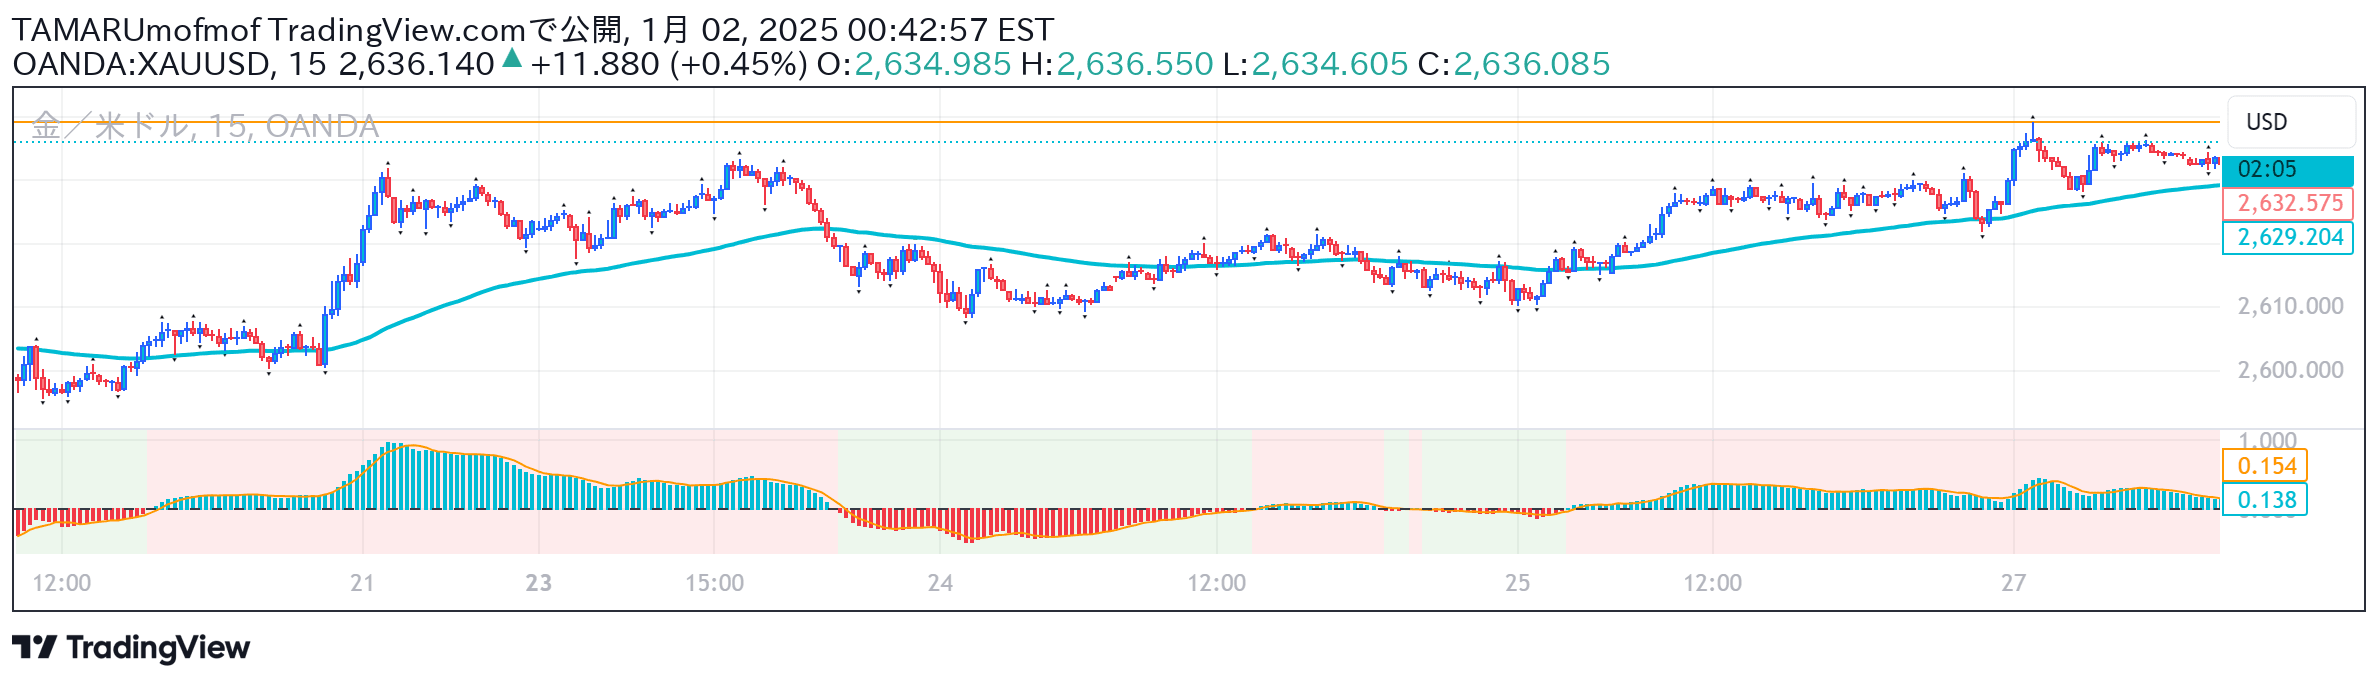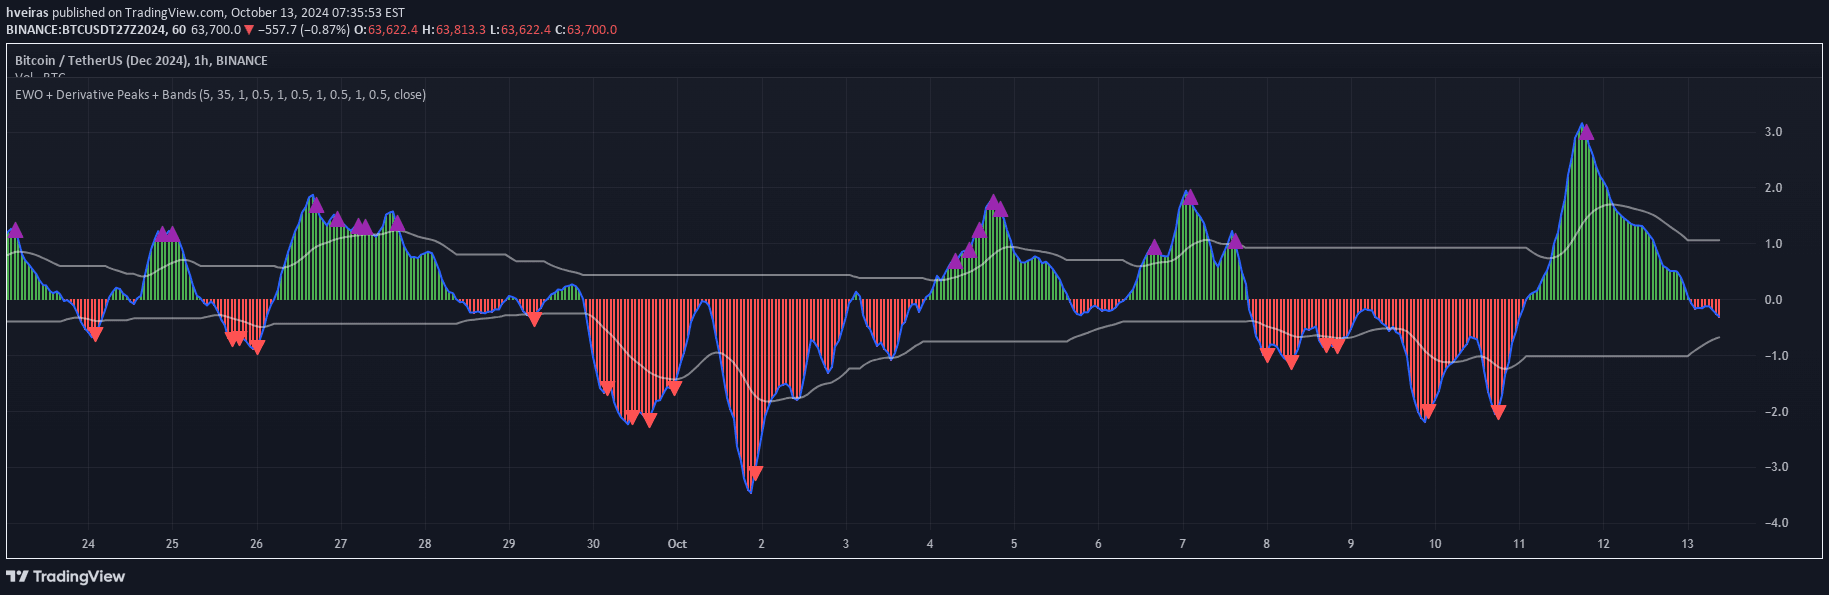
A technical indicator combining Elliott Wave theory with derivative peak detection and breakout bands to analyze market trends and potential reversals through advanced oscillator analysis.
Explore complementary indicator rolesHow it works
The Elliott Wave Oscillator calculates the difference between a short-term and long-term simple moving average (SMA), creating a dynamic oscillator that reflects market momentum. By using an exponential moving average (EMA) for smoothing, the indicator filters out market noise and provides a clearer trend representation.
The derivative peak detection analyzes the rate of change in the smoothed oscillator, identifying significant peaks and troughs by tracking transitions in momentum. Breakout bands are dynamically generated to help traders filter meaningful market movements, highlighting only peaks and troughs that exceed predetermined threshold levels.
Why it may be useful
This indicator provides traders with a sophisticated method of trend analysis that goes beyond traditional oscillator techniques by integrating multiple analytical approaches. By combining Elliott Wave theory, derivative analysis, and adaptive smoothing, traders gain a nuanced understanding of market momentum and potential trend reversals.
The visual representation, including color-coded histograms and smoothed trend lines, allows traders to quickly interpret complex market dynamics. The adaptive nature of the indicator makes it versatile across different timeframes and market conditions, offering insights that can improve trading decision-making.
When to explore it
The Elliott Wave Oscillator with Derivative Peak Detection is most effective in markets with clear trending characteristics, where momentum shifts are significant and identifiable. It performs exceptionally well in liquid markets with consistent price movements, such as major forex pairs, stock indices, and high-volume commodities.
Traders should leverage this indicator during periods of potential trend transitions, using its peak detection and breakout bands to confirm entry and exit points. It is particularly useful when combined with other trend-confirming indicators to validate signals and reduce the likelihood of false breakouts.
Keep exploring
What we’ve verified
Access, alerts and repainting behaviour have not been independently verified for this indicator. Check the creator’s current publication and settings.
General descriptions and classifications are recovered research. Verified details above identify the specific checks we have completed. Check the creator’s current publication for later changes.