
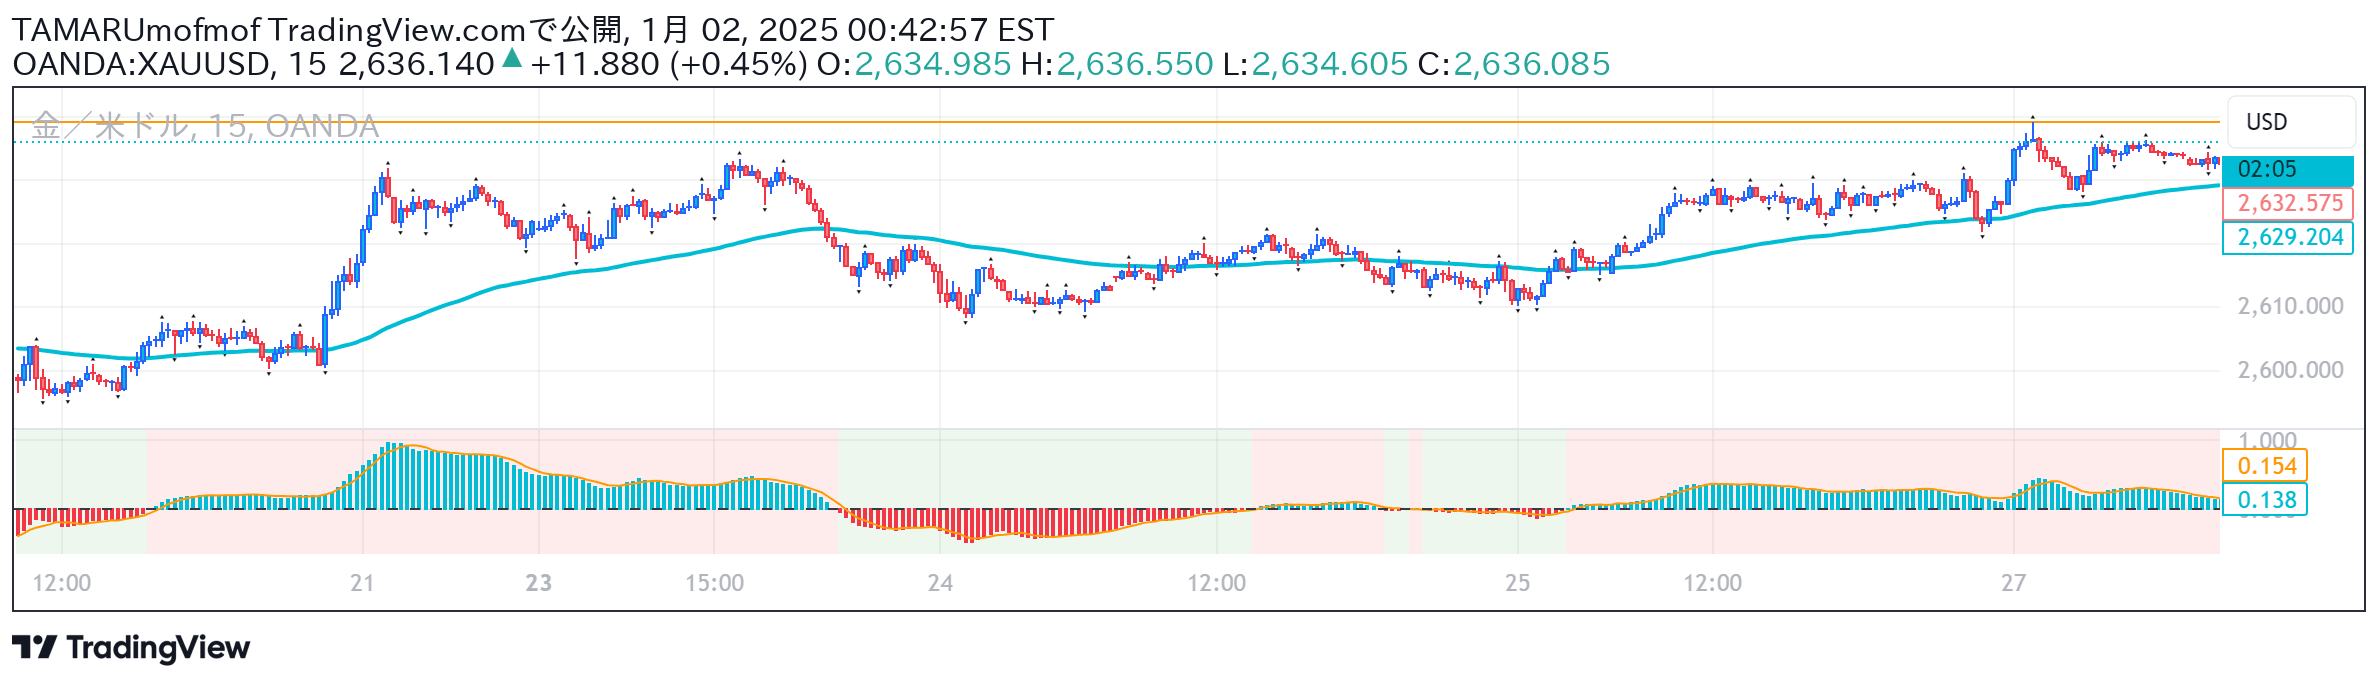
A technical indicator measuring price deviation from a moving average to identify potential overbought or oversold market conditions and trading opportunities.
Explore complementary indicator rolesHow it works
The DR Oscillator calculates the percentage difference between the current closing price and a simple moving average, creating a deviation measurement. It establishes upper and lower limits that help traders identify potential market turning points by highlighting when an asset might be overbought or oversold.
The oscillator can be further enhanced by smoothing the deviation using a moving average and adding optional signal lines for more nuanced analysis. By plotting the oscillator with different colors and background shades, traders can quickly visually interpret the current market conditions and potential trading signals.
Why it may be useful
The DR Oscillator provides traders with a versatile tool for understanding price momentum and potential trend reversals by quantifying how far an asset's price has deviated from its average. It offers a visual representation of market conditions that can help traders make more informed decisions about potential entry and exit points.
By measuring price deviation and establishing clear overbought and oversold zones, the oscillator helps traders identify potential market inefficiencies and opportunities that might not be immediately apparent from price action alone.
When to explore it
The DR Oscillator is most effective in markets with clear trending or ranging characteristics, where price tends to oscillate around a central moving average. It works particularly well in liquid markets with consistent price movements, such as major currency pairs, stock indices, and highly traded commodities.
Traders should use this oscillator in conjunction with other technical indicators and fundamental analysis to confirm signals and reduce the risk of false positives. It is especially useful during periods of moderate market volatility where price movements are more predictable and systematic.
Keep exploring
What we’ve verified
Access, alerts and repainting behaviour have not been independently verified for this indicator. Check the creator’s current publication and settings.
General descriptions and classifications are recovered research. Verified details above identify the specific checks we have completed. Check the creator’s current publication for later changes.



