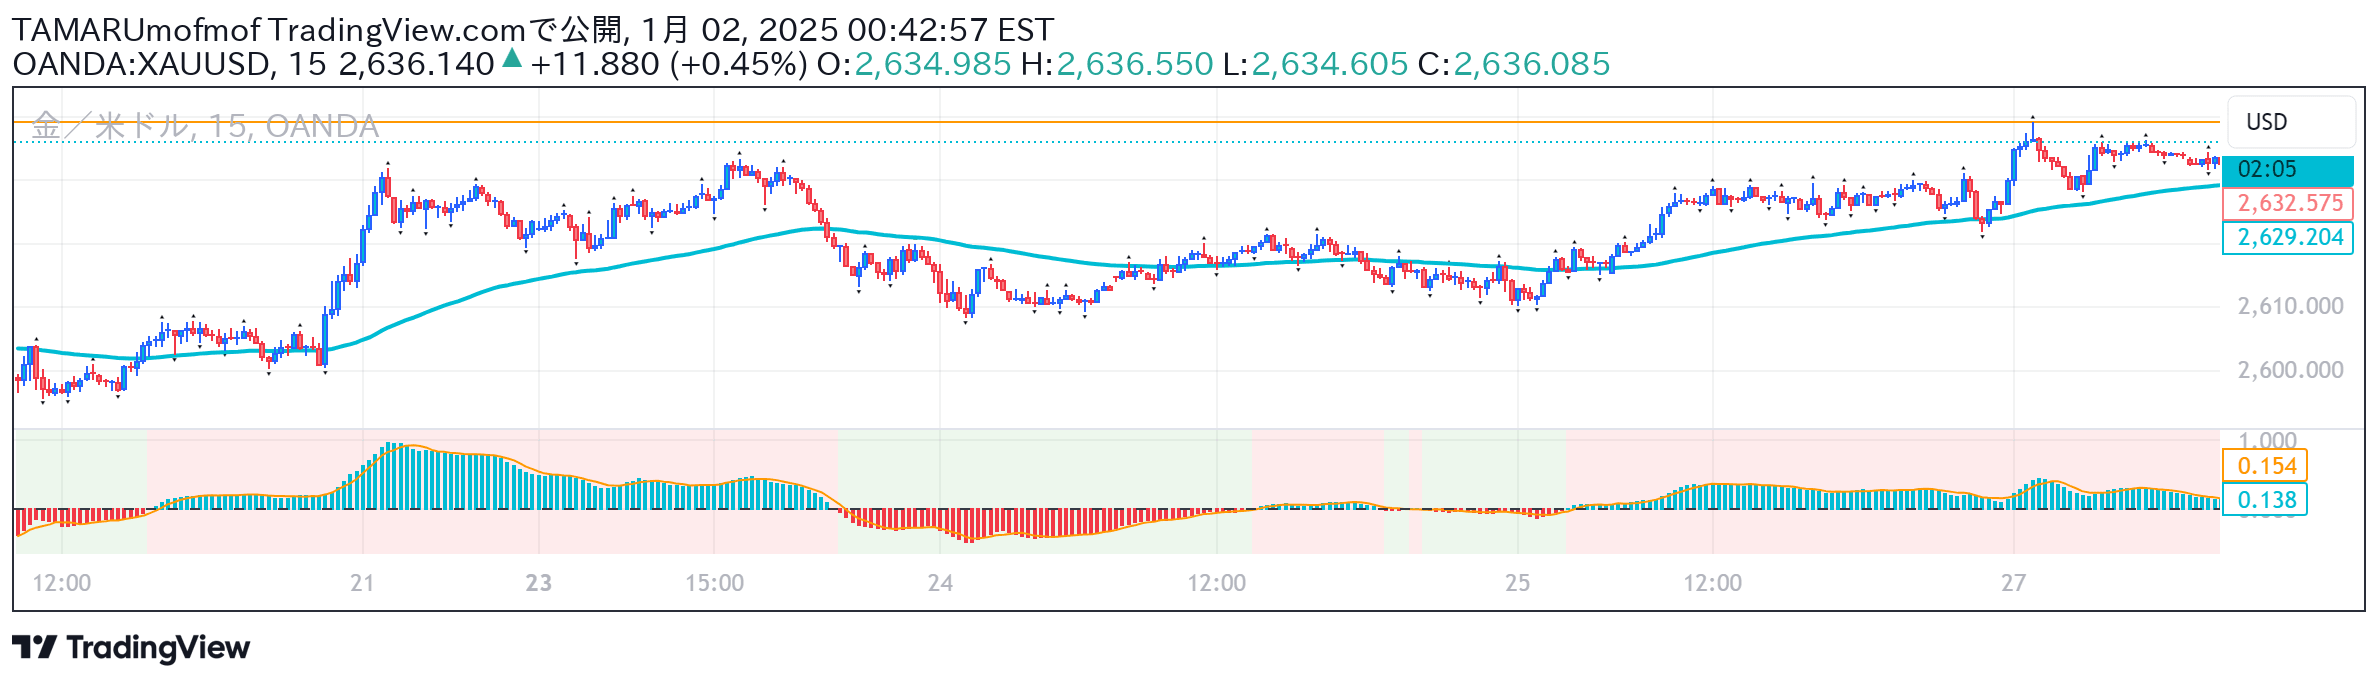
The Ultimate Balance Oscillator combines multiple technical indicators to provide a comprehensive market analysis tool that enhances trading precision and decision-making across different market conditions.
Explore complementary indicator rolesHow it works
The Ultimate Balance Oscillator integrates multiple technical indicators including Rate of Change (ROC), Relative Strength Index (RSI), Commodity Channel Index (CCI), Williams Percent Range, and Average Directional Index (ADX). Each component is strategically weighted to minimize signal correlation and provide a balanced market perspective.
By calculating a composite score through carefully assigned weights, the indicator creates a single line that represents the aggregate market momentum and trend strength. Traders can interpret this line by observing its relationship with a moving average, tracking crossovers, and identifying overbought or oversold conditions.
Why it may be useful
The Ultimate Balance Oscillator offers traders a sophisticated, multi-dimensional approach to market analysis by synthesizing insights from diverse technical indicators. Its comprehensive methodology eliminates the limitations of single-indicator strategies, providing a more robust and nuanced view of market dynamics.
By integrating multiple signals and implementing a refined weighting mechanism, the indicator reduces noise and enhances signal reliability. This approach empowers traders to make more informed decisions, potentially improving trade entry and exit timing across various market conditions and trading styles.
When to explore it
The Ultimate Balance Oscillator is most effective in markets with clear trending characteristics, where multiple technical indicators can converge to provide meaningful signals. It performs exceptionally well in liquid markets with sufficient price movement, such as major forex pairs, stock indices, and high-volume commodities.
Traders should utilize this indicator during periods of moderate to high market volatility, where its multi-indicator approach can capture subtle shifts in momentum and trend strength. It is particularly valuable when transitioning between market phases, helping traders identify potential trend reversals and momentum changes.
Keep exploring
What we’ve verified
Access, alerts and repainting behaviour have not been independently verified for this indicator. Check the creator’s current publication and settings.
General descriptions and classifications are recovered research. Verified details above identify the specific checks we have completed. Check the creator’s current publication for later changes.