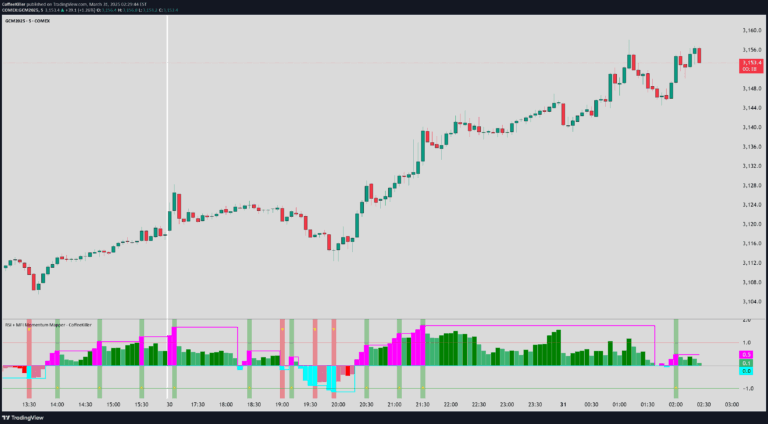
A multi-timeframe RSI indicator that combines advanced RSI calculations with EMA trend filtering to provide precise trading signals across different market conditions and timeframes.
Explore complementary indicator rolesHow it works
The Dual Spectrum RSI operates by utilizing two RSI calculations simultaneously: a primary RSI on a higher timeframe for trend identification and a secondary RSI on the current chart timeframe for entry signals. The indicator integrates an Exponential Moving Average (EMA) as a trend filter, which helps validate the market's overall direction and reduce false signals.
The system dynamically adapts to different timeframe settings, allowing traders to choose between automatic, multiplier-based, or manual resolution. By analyzing RSI crossovers in both oversold and overbought zones and filtering these through the higher timeframe EMA, the indicator generates precise buy and sell signals with visual labels and gradient-filled zones.
Why it may be useful
The Dual Spectrum RSI provides traders with a comprehensive market analysis tool that goes beyond traditional single-timeframe indicators. By incorporating multi-layered RSI calculations and trend filtering, it offers a more nuanced view of market dynamics, helping traders make more informed and confident trading decisions.
The indicator's ability to adapt to different trading styles and timeframes makes it versatile for various market participants. Its user-friendly interface, combined with customizable visualization options and real-time trend insights, empowers traders to reduce emotional bias and develop more systematic trading strategies.
When to explore it
The Dual Spectrum RSI is most effective in markets with clear trend characteristics and moderate volatility. It performs exceptionally well in trending markets where traders want to identify both trend continuation and potential reversal points. The indicator is particularly useful when traders need a comprehensive view of market conditions across multiple timeframes.
Traders can leverage this tool in various scenarios, such as capturing short-term scalping opportunities, confirming day trading entries, or identifying swing trading potential. It is especially valuable when markets exhibit recognizable momentum shifts and when traders want to align their trades with the broader market trend.
Keep exploring
What we’ve verified
Access, alerts and repainting behaviour have not been independently verified for this indicator. Check the creator’s current publication and settings.
General descriptions and classifications are recovered research. Verified details above identify the specific checks we have completed. Check the creator’s current publication for later changes.