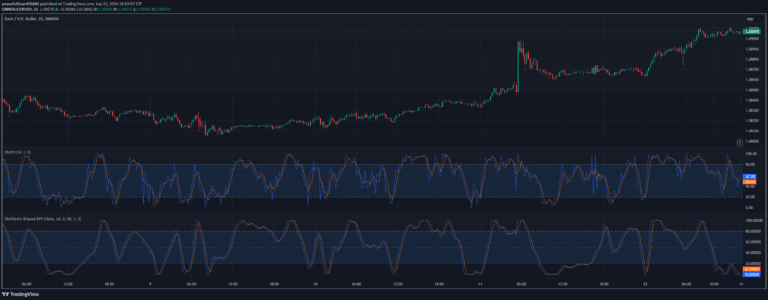
A multi-timeframe stochastic oscillator system using 28 different stochastic lengths to analyze market momentum and generate trading signals through color-coded visualization.
Explore complementary indicator rolesHow it works
This indicator creates 28 stochastic oscillators with varying lengths, stacked vertically from short-term to long-term perspectives. Each oscillator is color-coded based on its interpreted value, creating a visual momentum map.
The system calculates an average of these 28 stochastics to generate a fast oscillator line and a corresponding slow oscillator line. Traders can use multiple smoothing methods and customize color themes to enhance signal interpretation. The oscillator lines can also be used to color price candles, providing additional visual context for momentum changes
Why it may be useful
This multi-layered stochastic approach offers traders a comprehensive view of market momentum across different timeframes. By combining 28 stochastic oscillators, traders can identify subtle momentum shifts that might be missed by traditional single-timeframe indicators.
The color-coded visualization allows for quick, intuitive understanding of market conditions. The flexible design enables customization of smoothing methods and color themes, making it adaptable to various trading styles and market environments
When to explore it
This indicator works best in markets with clear momentum trends and when traders want a nuanced, multi-timeframe analysis. It is particularly effective for swing traders seeking to identify potential trend reversals and momentum shifts.
The system is most reliable in liquid markets with consistent price movements, such as major forex pairs, large-cap stocks, and prominent index futures. Traders should use this indicator in conjunction with other technical analysis tools to confirm signals and reduce false positives
Keep exploring
What we’ve verified
Access, alerts and repainting behaviour have not been independently verified for this indicator. Check the creator’s current publication and settings.
General descriptions and classifications are recovered research. Verified details above identify the specific checks we have completed. Check the creator’s current publication for later changes.