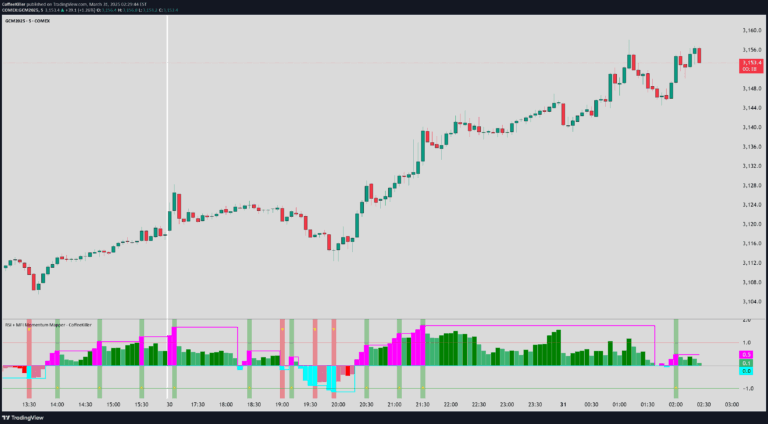
A multi-timeframe stochastic oscillator tool that helps traders detect market momentum shifts, overbought/oversold conditions, and potential trend reversals across four distinct configurations.
Explore complementary indicator rolesHow it works
The Stoch Quad Oscillator analyzes four different stochastic configurations simultaneously, using varying timeframe lengths from 9 to 60 periods. Each configuration calculates %K and %D lines with different smoothing techniques, allowing traders to simultaneously view short-term, medium-term, and long-term momentum indicators.
By plotting these stochastic lines with different colors and tracking their collective behavior, the tool provides a comprehensive view of market momentum. It incorporates advanced detection mechanisms like quad rotation, which identifies synchronized oversold or overbought conditions across all four stochastic readings.
Why it may be useful
This indicator provides traders with a nuanced, multi-dimensional view of market momentum that goes beyond traditional single-timeframe analysis. By integrating four distinct stochastic configurations, it offers a more robust assessment of potential trend shifts and market dynamics.
The tool's ability to highlight quad rotation signals and provide visual cues about market conditions helps traders make more informed decisions. Its flexible parameters and multi-timeframe approach allow for adaptable analysis across different trading styles and market environments.
When to explore it
The Stoch Quad Oscillator is most effective in markets with clear trending or momentum-driven characteristics, where multiple timeframe confirmations can provide stronger trading insights. It works particularly well when combined with other technical analysis tools like volume indicators, MACD, or price action patterns.
Traders should be especially attentive to this indicator during potential trend reversal zones, when multiple stochastic lines simultaneously indicate overbought or oversold conditions. It's particularly useful for identifying momentum shifts in forex, stocks, and cryptocurrency markets across various timeframes.
Keep exploring
What we’ve verified
Access, alerts and repainting behaviour have not been independently verified for this indicator. Check the creator’s current publication and settings.
General descriptions and classifications are recovered research. Verified details above identify the specific checks we have completed. Check the creator’s current publication for later changes.