
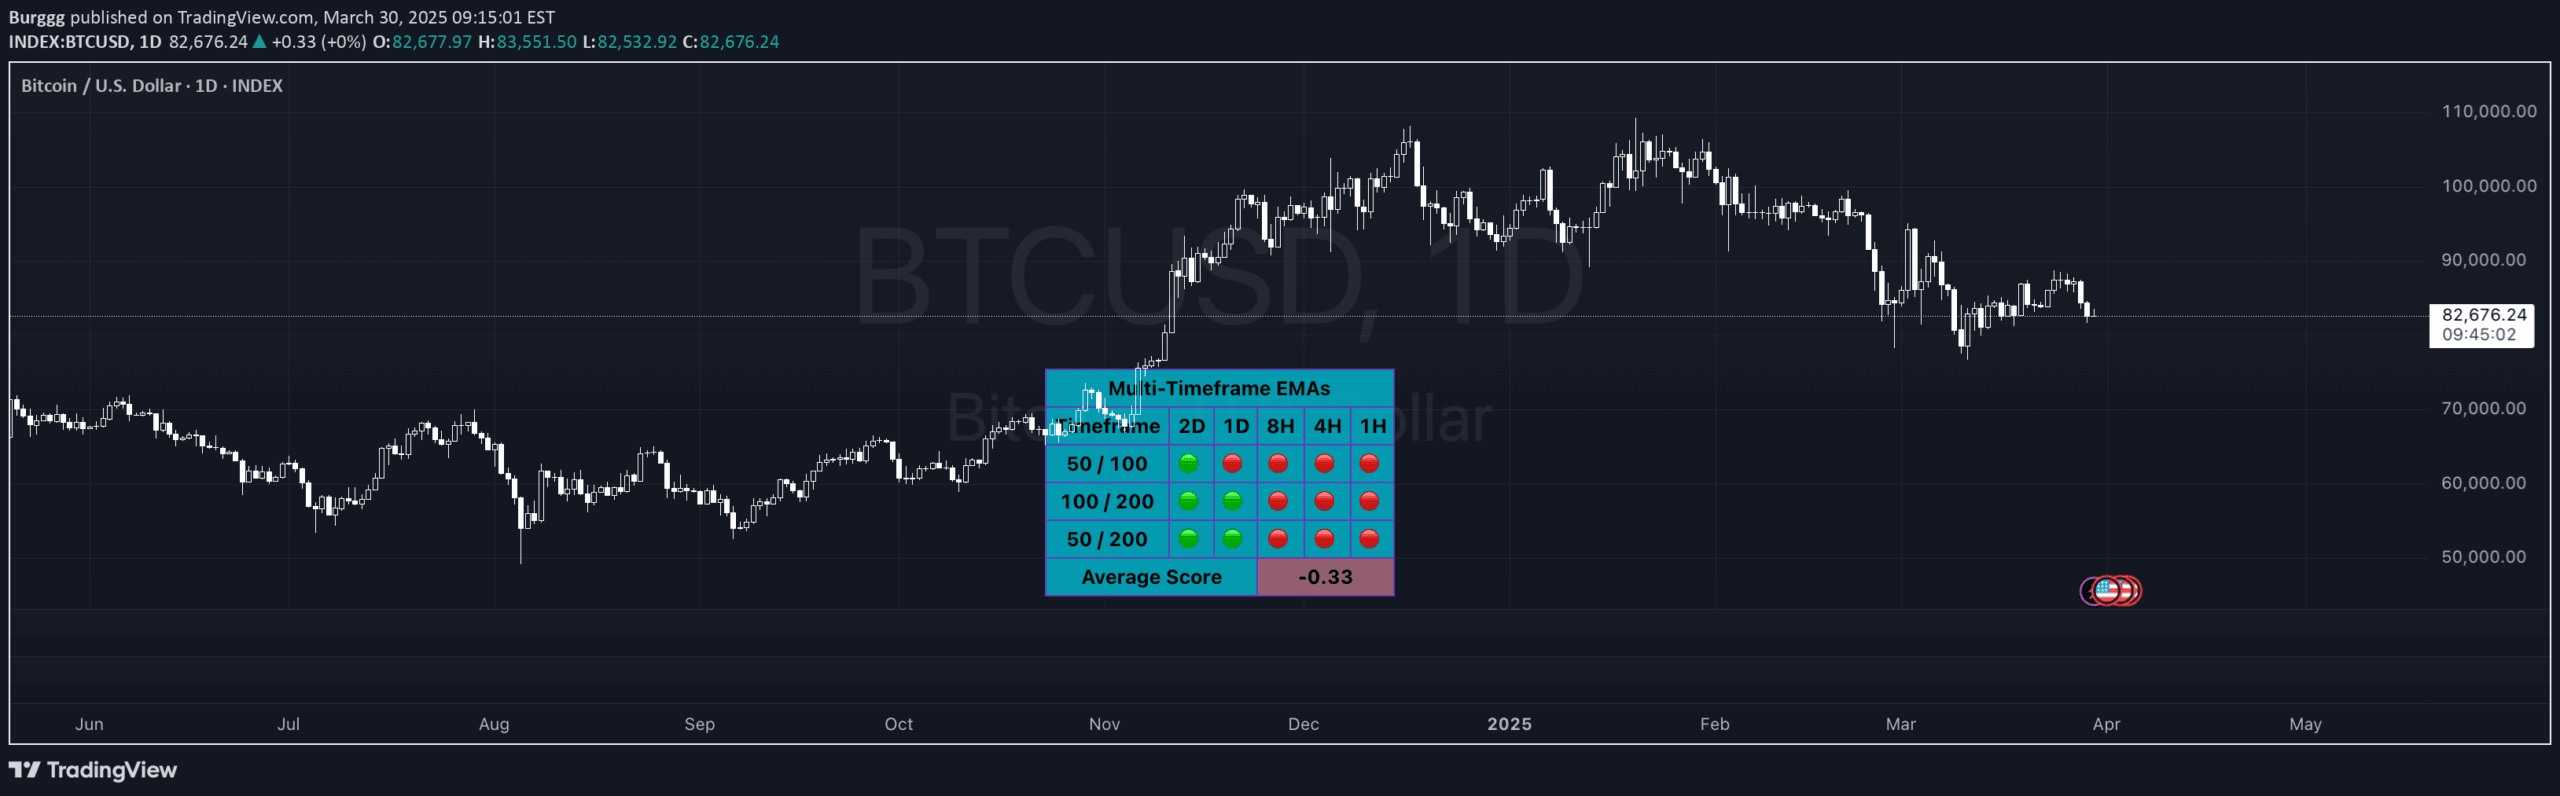
A multi-timeframe EMA analysis tool that compares exponential moving averages across different periods to determine trend direction and momentum by scoring the relationship between different EMA bands.
Explore complementary indicator rolesHow it works
The Multi-Timeframe EMA Band Comparison calculates 50, 100, and 200 period exponential moving averages across five different timeframes. It then compares these EMAs in three key relationships: 50 vs 100, 100 vs 200, and 50 vs 200 periods.
Each comparison is scored as bullish (green), bearish (red), or neutral (white) based on the relative positioning of the moving averages. An overall average score ranging from 1 to -1 is computed to provide a comprehensive trend assessment
Why it may be useful
This indicator helps traders understand trend dynamics across multiple timeframes simultaneously. By providing a comprehensive view of momentum, it allows traders to make more informed decisions about market direction.
The scoring system offers a quick visual representation of bullish or bearish sentiment, reducing the complexity of interpreting multiple moving averages. It helps traders identify potential trend changes, confirm existing trends, and understand the broader market context beyond a single timeframe
When to explore it
The Multi-Timeframe EMA Band Comparison is most effective during trending markets with clear directional movement. It works best for traders seeking a comprehensive trend analysis across different timeframes.
Traders can use this indicator when they want to confirm trend strength, identify potential trend reversals, or compare market momentum across various periods. It is particularly useful for swing and day traders who need a quick, multi-timeframe perspective on market trends
Keep exploring
What we’ve verified
Access, alerts and repainting behaviour have not been independently verified for this indicator. Check the creator’s current publication and settings.
General descriptions and classifications are recovered research. Verified details above identify the specific checks we have completed. Check the creator’s current publication for later changes.




