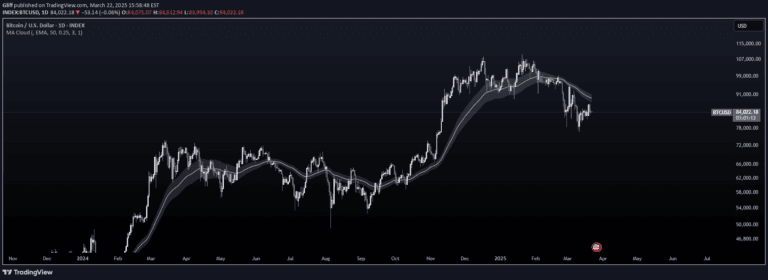
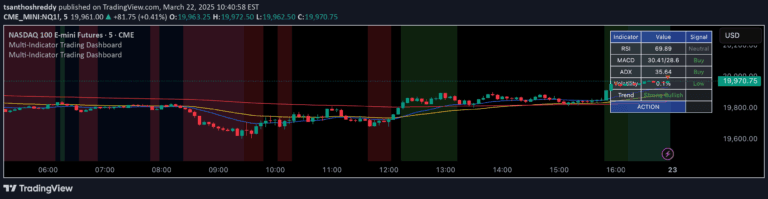
A multi-timeframe moving average indicator that allows traders to plot and compare exponential and simple moving averages across six different timeframes simultaneously.
Explore complementary indicator rolesHow it works
The Multi Timeframe MAs indicator calculates moving averages using either exponential or simple methods across different timeframes. By allowing users to select specific timeframes and moving average types, the script dynamically generates lines representing trend dynamics at various time intervals.
The script uses a flexible ternary operator to determine the moving average calculation method, enabling seamless switching between EMA and SMA. Users can customize periods and toggle visibility for each moving average, providing a comprehensive view of market trends across multiple timeframe perspectives.
Why it may be useful
Multi Timeframe MAs are crucial for traders seeking a comprehensive understanding of market trends beyond single-timeframe analysis. By displaying moving averages from different time perspectives simultaneously, traders can identify complex trend interactions and potential trend confirmations or divergences.
The indicator's flexibility allows traders to develop more nuanced trading strategies by observing how different timeframe moving averages relate and interact. This multi-dimensional approach provides deeper insights into market dynamics, helping traders make more informed decisions based on a holistic view of price movement.
When to explore it
The Multi Timeframe MAs indicator is most effective during trending market conditions where clear directional movements are prevalent. Traders can utilize this tool when seeking to confirm trend strength, identify potential trend reversals, or evaluate market momentum across multiple timeframes.
This indicator becomes particularly valuable during periods of market transition, such as when short-term and long-term trends show different signals. By comparing moving averages from various timeframes, traders can gain a more comprehensive understanding of market structure and potential future price movements.
Keep exploring
What we’ve verified
Access, alerts and repainting behaviour have not been independently verified for this indicator. Check the creator’s current publication and settings.
General descriptions and classifications are recovered research. Verified details above identify the specific checks we have completed. Check the creator’s current publication for later changes.