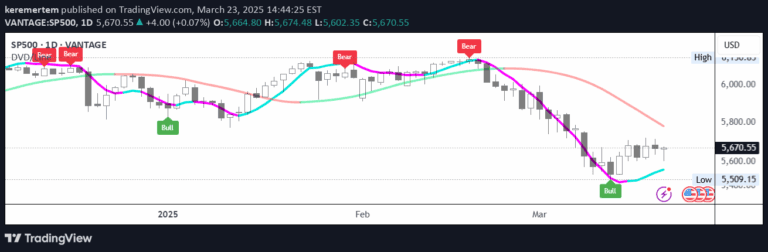
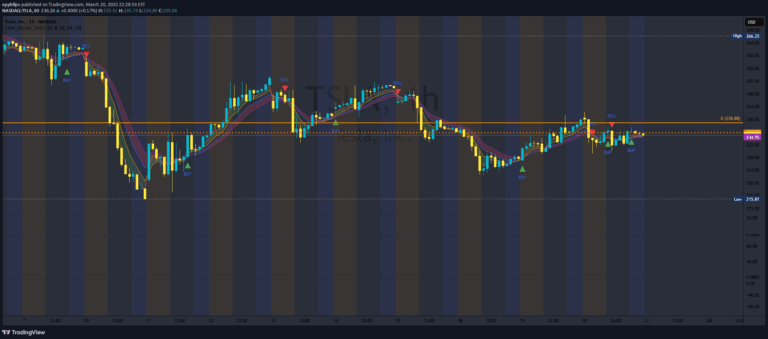
A multi-timeframe moving average indicator that provides comprehensive trend analysis by displaying up to four MAs across different periods and styles.
Explore complementary indicator rolesHow it works
The MA Multi-Timeframe indicator calculates moving averages across different timeframes by allowing users to select up to four distinct MAs. Each MA can be configured with a specific type like SMA, EMA, or VWMA, and assigned to a unique timeframe such as daily, weekly, or monthly.
The indicator plots these MAs as polylines, creating smooth curves that represent price trends over up to 4000 historical bars. A built-in dashboard simultaneously displays each MA's current relationship to price, helping traders quickly understand trend dynamics across multiple time horizons.
Why it may be useful
Multi-timeframe moving averages provide traders with a more comprehensive market perspective by revealing trend characteristics across different time scales. By comparing MAs from various periods, traders can identify potential trend confirmations, divergences, and overall market momentum more effectively than single-timeframe analysis.
The flexible configuration options allow traders to customize their analysis to match specific trading strategies, market conditions, and personal preferences. This adaptability makes the indicator valuable for traders seeking nuanced insights into price movement and trend strength.
When to explore it
This indicator is most effective during trending market conditions where clear directional movement exists across multiple timeframes. It becomes particularly useful when traders want to confirm trend strength, identify potential trend reversals, or assess market sentiment from a broader perspective.
Traders can leverage this tool during periods of market transition, such as when price is approaching key support or resistance levels, or when seeking to validate signals from other technical indicators. Its multi-timeframe approach provides a more robust analytical framework compared to single-timeframe moving average strategies.
Keep exploring
What we’ve verified
Access, alerts and repainting behaviour have not been independently verified for this indicator. Check the creator’s current publication and settings.
General descriptions and classifications are recovered research. Verified details above identify the specific checks we have completed. Check the creator’s current publication for later changes.