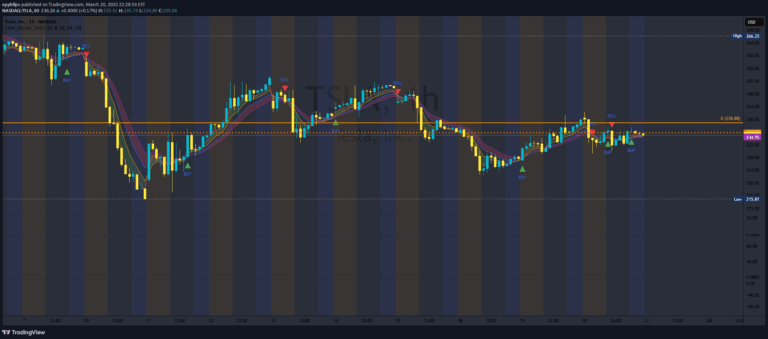
A DSL Trend Analysis indicator that tracks price momentum using dynamic signal lines and bands, providing visual insights into trend strength and potential market shifts.
Explore complementary indicator rolesHow it works
The DSL Trend Analysis indicator operates by utilizing Discontinued Signal Lines (DSL) plotted directly on price, creating dynamic upper and lower bands based on Average True Range (ATR). These bands serve as adaptive thresholds for measuring price momentum, with the indicator tracking whether price highs and lows exceed or remain within these bands.
When the high price stays above the upper DSL band, the line turns lime, signaling strong upward momentum. Conversely, when the low price remains below the lower DSL band, the line turns orange, indicating strong downward momentum. The bands' transparency changes to reflect weakening trend strength, providing traders with nuanced insights into price movement dynamics.
Why it may be useful
The DSL Trend Analysis indicator is crucial for traders seeking to understand market momentum and trend strength with visual clarity. By transforming abstract price movements into color-coded signals, it simplifies complex market dynamics, allowing traders to quickly assess whether a trend is gaining or losing strength.
Moreover, the indicator's real-time band price labels and dynamic color changes provide immediate visual feedback, helping traders make more informed decisions about potential entry and exit points. This approach reduces subjective interpretation and offers a systematic method for evaluating market momentum across different trading timeframes.
When to explore it
The DSL Trend Analysis indicator is most effective in markets experiencing clear directional movements, where price shows consistent trends in either upward or downward directions. It works particularly well in liquid markets with sufficient price volatility, such as forex, futures, and actively traded stocks.
Traders should be most attentive to this indicator during periods of market transition, when momentum might be shifting between strong and weak trends. It is especially valuable during breakout scenarios, trending market conditions, and when seeking to confirm potential trend reversals or continuations.
Keep exploring
What we’ve verified
Access, alerts and repainting behaviour have not been independently verified for this indicator. Check the creator’s current publication and settings.
General descriptions and classifications are recovered research. Verified details above identify the specific checks we have completed. Check the creator’s current publication for later changes.