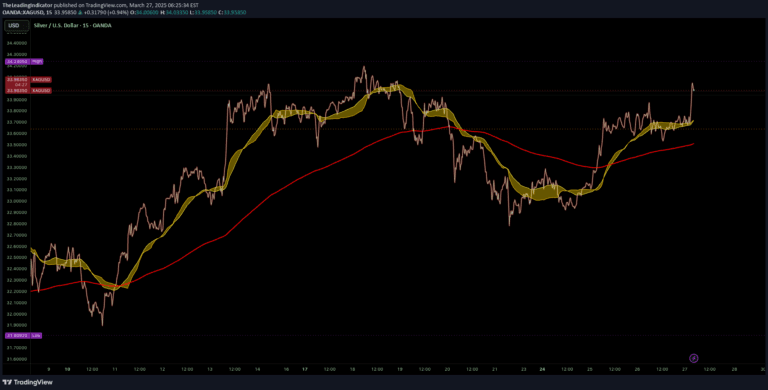
A multi-period moving average indicator that provides trend strength and direction analysis through color-coded lines and histogram visualization, helping traders identify market momentum and potential entry points.
Explore complementary indicator rolesHow it works
The Multi Deviation Scaled Moving Average (DSMA) calculates eight moving averages with incrementally increasing periods, creating a comprehensive trend analysis tool. It uses a sophisticated algorithm that adapts to market volatility by scaling the moving averages based on price fluctuations.
The indicator generates a color-coded line that represents trend strength and direction, with different colors indicating bullish or bearish market conditions. Additionally, it produces a histogram that visualizes the percentage of trend strength, allowing traders to quickly understand the current market sentiment and potential directional movements.
Why it may be useful
This indicator provides traders with a nuanced view of market trends by combining multiple moving averages into a single, easy-to-interpret visualization. It offers deeper insights than traditional moving averages by adapting to market volatility and presenting trend information through color and histogram representations.
The Multi Deviation Scaled Moving Average helps traders make more informed decisions by quickly identifying trend strength, potential entry and exit points, and overall market bias. Its sophisticated approach allows for a more comprehensive understanding of market dynamics across different timeframes and trading styles.
When to explore it
The Multi Deviation Scaled Moving Average is most effective in markets with clear trending conditions, where price movements show consistent directional momentum. It performs exceptionally well in moderately volatile markets where trend identification can provide significant trading advantages.
Traders should apply this indicator across multiple timeframes to confirm trend signals and validate potential trading opportunities. It is particularly useful when combined with other technical analysis tools to enhance signal confirmation and reduce false trading signals.
Keep exploring
What we’ve verified
Access, alerts and repainting behaviour have not been independently verified for this indicator. Check the creator’s current publication and settings.
General descriptions and classifications are recovered research. Verified details above identify the specific checks we have completed. Check the creator’s current publication for later changes.