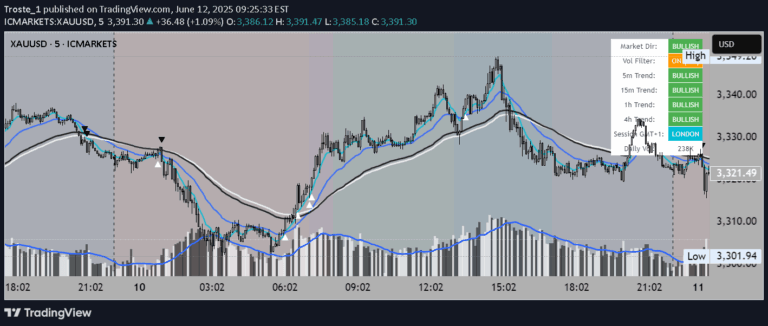
The Granular MA Ribbon combines exponential and volume-weighted moving averages to provide a detailed view of price action and momentum across multiple timeframes.
Explore complementary indicator rolesHow it works
The Granular MA Ribbon uses multiple moving averages calculated from 15-minute intervals to track price dynamics. It incorporates a one-day exponential moving average (1D EMA), a one-day volume-weighted moving average (1D VWMA), and a one-week exponential moving average (1W EMA).
By breaking trading days into 96 fifteen-minute blocks, the indicator creates a more granular representation of market trends. The ribbon between the EMA and VWMA visually demonstrates momentum strength, with wider ribbons indicating stronger trends and narrower ribbons suggesting potential consolidation or trend weakening.
Why it may be useful
Traditional moving averages often lag behind price changes, but this indicator provides a more responsive and nuanced view of market movements. By combining different moving average types, traders can gain deeper insights into price momentum and trend strength.
The inclusion of volume-weighted moving averages ensures that price movements supported by higher trading activity are given more significance. This approach helps traders distinguish between meaningful price shifts and potentially less substantive market noise.
When to explore it
The Granular MA Ribbon is most effective on 15-minute and 1-hour charts, offering precise insights for intraday trading strategies. It works exceptionally well in identifying trend strength, momentum shifts, and potential entry or exit points during active market conditions.
In trending markets, the ribbon helps traders time pullback entries and confirm trend continuation. During sideways or range-bound markets, it can signal potential breakouts or periods of reduced volatility, making it a versatile tool for adapting to changing market environments.
Keep exploring
What we’ve verified
Access, alerts and repainting behaviour have not been independently verified for this indicator. Check the creator’s current publication and settings.
General descriptions and classifications are recovered research. Verified details above identify the specific checks we have completed. Check the creator’s current publication for later changes.