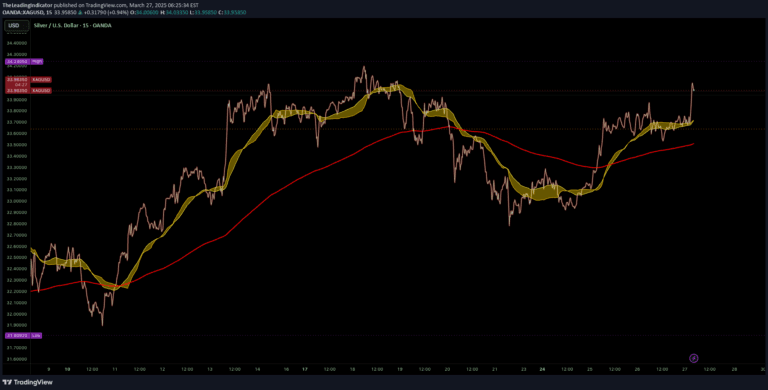
A multi-layered Hull Moving Average system that creates a dynamic ribbon across 12 timeframes, providing visual trend analysis and momentum insights with reduced lag.
Explore complementary indicator rolesHow it works
The Gradient Wave HMA calculates 12 Hull Moving Averages simultaneously, each with a different period length, creating a comprehensive ribbon visualization. The middle HMA (6th line) determines the trend direction, triggering color changes across the entire ribbon from purple to pink gradients.
By using Alan Hull's innovative lag-reduction formula, the indicator smooths price data more effectively than traditional moving averages. The ribbon's expansion, contraction, and angle provide immediate visual cues about market momentum, trend strength, and potential directional changes.
Why it may be useful
The Gradient Wave HMA offers traders a sophisticated, visually intuitive tool for understanding market dynamics with greater precision than traditional moving average systems. Its multi-period approach provides a comprehensive view of market trends, allowing traders to quickly assess momentum and potential trend reversals across different timeframes.
By combining technical innovation with advanced visualization techniques, this indicator helps traders make more informed decisions by reducing lag, offering clear trend signals, and providing multiple layers of trend confirmation through its unique ribbon structure.
When to explore it
The Gradient Wave HMA is most effective when used on higher timeframes like 4-hour and daily charts for position trading and trend identification. It works best in markets with clear trending conditions, where price is moving consistently in one direction and showing strong momentum.
Traders should combine this indicator with volume indicators for additional confirmation and watch for specific ribbon behaviors like compression before potential breakouts or expansion during strong trending periods. It is particularly useful for traders seeking a comprehensive, visually engaging trend-following tool.
Keep exploring
What we’ve verified
Access, alerts and repainting behaviour have not been independently verified for this indicator. Check the creator’s current publication and settings.
General descriptions and classifications are recovered research. Verified details above identify the specific checks we have completed. Check the creator’s current publication for later changes.