SUPeR TReND 2.718
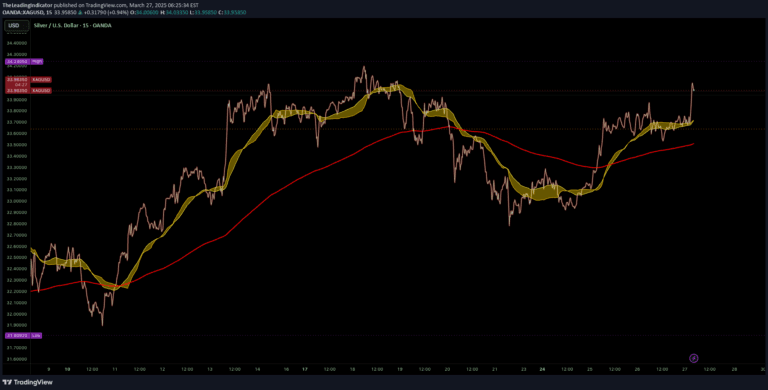
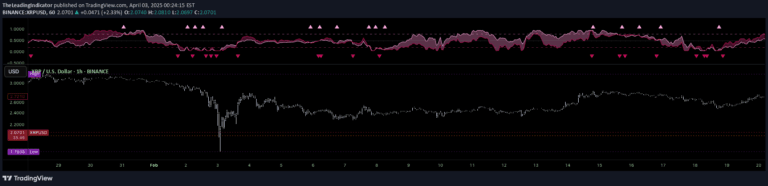
SUPeR TReND 2.718 is an advanced Supertrend indicator using Euler's constant, providing precise trend detection with dynamic visual layers and customizable trend tracking.
Explore 11,183 indicators. Filter beyond the obvious.
Discover the tools that fit the way you trade.
11,183 tools to explore
SUPeR TReND 2.718 is an advanced Supertrend indicator using Euler's constant, providing precise trend detection with dynamic visual layers and customizable trend tracking.
ZVOL transforms raw volume data into a statistically calibrated heatmap using Z-score thresholds, revealing meaningful crowd behavior across different market conditions.
Volumetric Tensegrity is a compact volume analysis tool that measures market pressure and directional conviction through volume deviation and on-balance volume tracking.
Money Flow Pulse (MFP) is a volume-driven indicator that analyzes price action and volume to reveal the quality and conviction behind market movements across different timeframes.
OverUnder is a yield curve regime visualizer that helps traders understand macro market conditions by analyzing the slope and structure of interest rate spreads.
The Relative Directional Index (RDI) combines ADX and RSI to provide a comprehensive view of trend strength and momentum, helping traders identify potential entry and exit points.
VoluTility is a volume-based indicator that forecasts trend exhaustion and breakout potential by measuring volatility within the trading volume stream.
A dynamic visualization tool that maps candle pressure through effort and result, using volume and range to color-code market phases and energy shifts across trading timeframes.
Gold/Silver Ratio tracking tool that reveals market structure and potential trade opportunities by comparing gold and silver price dynamics using percentile bands and moving averages.
An advanced volume analysis tool that translates crowd participation into dynamic effort zones, revealing market pressure, conviction, and potential trend movements through color-coded volume tiers.
The Granular MA Ribbon combines exponential and volume-weighted moving averages to provide a detailed view of price action and momentum across multiple timeframes.
AltSeason indicator tracks altcoin strength relative to Bitcoin dominance, helping traders identify capital rotation and market cycles across different timeframes.
Likes, views, and comments are historical TradingView snapshots. They describe attention, not trading performance.